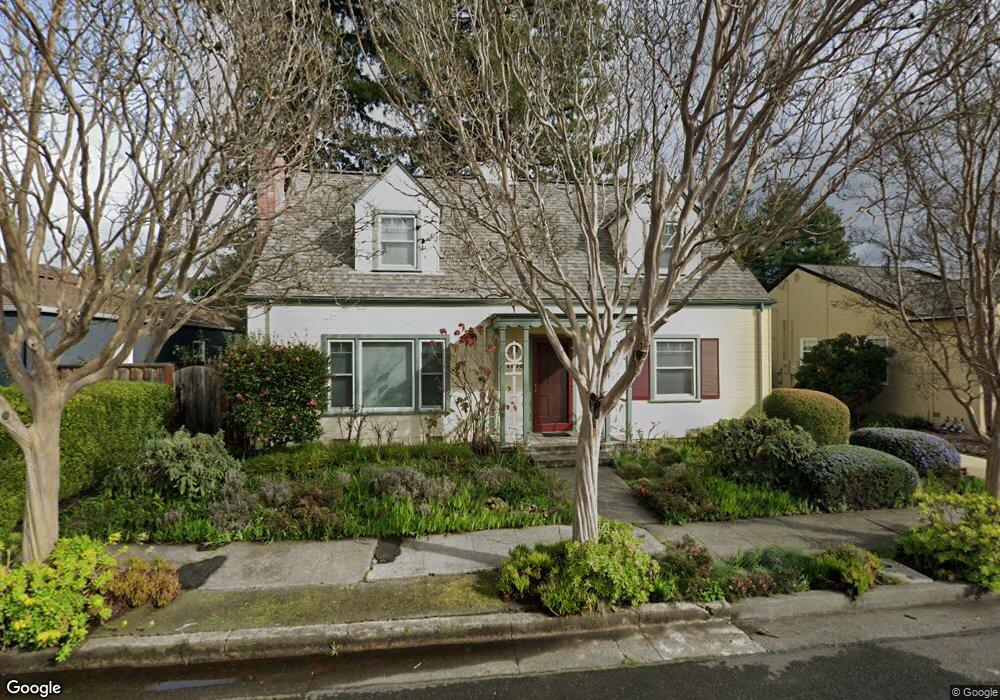
1158 Neale Dr Santa Rosa, CA 95404
Junior College NeighborhoodEstimated Value: $705,104 - $932,000
3
Beds
2
Baths
1,616
Sq Ft
$484/Sq Ft
Est. Value
About This Home
This home is located at 1158 Neale Dr, Santa Rosa, CA 95404 and is currently estimated at $782,276, approximately $484 per square foot. 1158 Neale Dr is a home located in Sonoma County with nearby schools including Proctor Terrace Elementary School, Santa Rosa Middle School, and Santa Rosa High School.
Ownership History
Date
Name
Owned For
Owner Type
Purchase Details
Closed on
Dec 16, 2016
Sold by
Mcgowan Charles David
Bought by
Mcgowan Charles David and The Charles David Mcgowan Trus
Current Estimated Value
Home Financials for this Owner
Home Financials are based on the most recent Mortgage that was taken out on this home.
Original Mortgage
$112,000
Outstanding Balance
$54,010
Interest Rate
3.57%
Mortgage Type
New Conventional
Estimated Equity
$728,266
Purchase Details
Closed on
Aug 3, 2005
Sold by
Mcgowan Charles D
Bought by
Mcgowan Charles D and Charles D Mcgowan Trust
Purchase Details
Closed on
Aug 23, 1994
Sold by
Stamp Paula
Bought by
Mcgowan Charles D
Home Financials for this Owner
Home Financials are based on the most recent Mortgage that was taken out on this home.
Original Mortgage
$145,000
Interest Rate
8.65%
Create a Home Valuation Report for This Property
The Home Valuation Report is an in-depth analysis detailing your home's value as well as a comparison with similar homes in the area
Home Values in the Area
Average Home Value in this Area
Purchase History
| Date | Buyer | Sale Price | Title Company |
|---|---|---|---|
| Mcgowan Charles David | -- | Fidelity National Title Co | |
| Mcgowan Charles David | -- | Fidelity National Title Co | |
| Mcgowan Charles D | -- | -- | |
| Mcgowan Charles D | $216,000 | First American Title |
Source: Public Records
Mortgage History
| Date | Status | Borrower | Loan Amount |
|---|---|---|---|
| Open | Mcgowan Charles David | $112,000 | |
| Previous Owner | Mcgowan Charles D | $145,000 |
Source: Public Records
Tax History Compared to Growth
Tax History
| Year | Tax Paid | Tax Assessment Tax Assessment Total Assessment is a certain percentage of the fair market value that is determined by local assessors to be the total taxable value of land and additions on the property. | Land | Improvement |
|---|---|---|---|---|
| 2025 | $4,026 | $362,745 | $134,344 | $228,401 |
| 2024 | $4,026 | $355,633 | $131,710 | $223,923 |
| 2023 | $4,026 | $348,661 | $129,128 | $219,533 |
| 2022 | $3,716 | $341,826 | $126,597 | $215,229 |
| 2021 | $3,669 | $335,124 | $124,115 | $211,009 |
| 2020 | $3,660 | $331,689 | $122,843 | $208,846 |
| 2019 | $3,640 | $325,186 | $120,435 | $204,751 |
| 2018 | $3,619 | $318,811 | $118,074 | $200,737 |
| 2017 | $3,553 | $312,560 | $115,759 | $196,801 |
| 2016 | $3,522 | $306,433 | $113,490 | $192,943 |
| 2015 | $3,415 | $301,831 | $111,786 | $190,045 |
| 2014 | $3,205 | $295,920 | $109,597 | $186,323 |
Source: Public Records
Map
Nearby Homes
- 1158 Humboldt St
- 1320 North St Unit 33
- 1240 North St
- 1404 Slater St
- 804 Beaver St
- 1690 Beaver St
- 763 Beaver St
- 642 Wright St
- 743 Beaver St
- 722 Beaver St
- 726 Orchard St
- 722 Orchard St
- 1720 Slater St
- 705 College Ave
- 740 Mendocino Ave
- 714 Mendocino Ave
- 542 College Ave
- 810 7th St Unit 23
- 840 5th St
- 1805 Austin Way