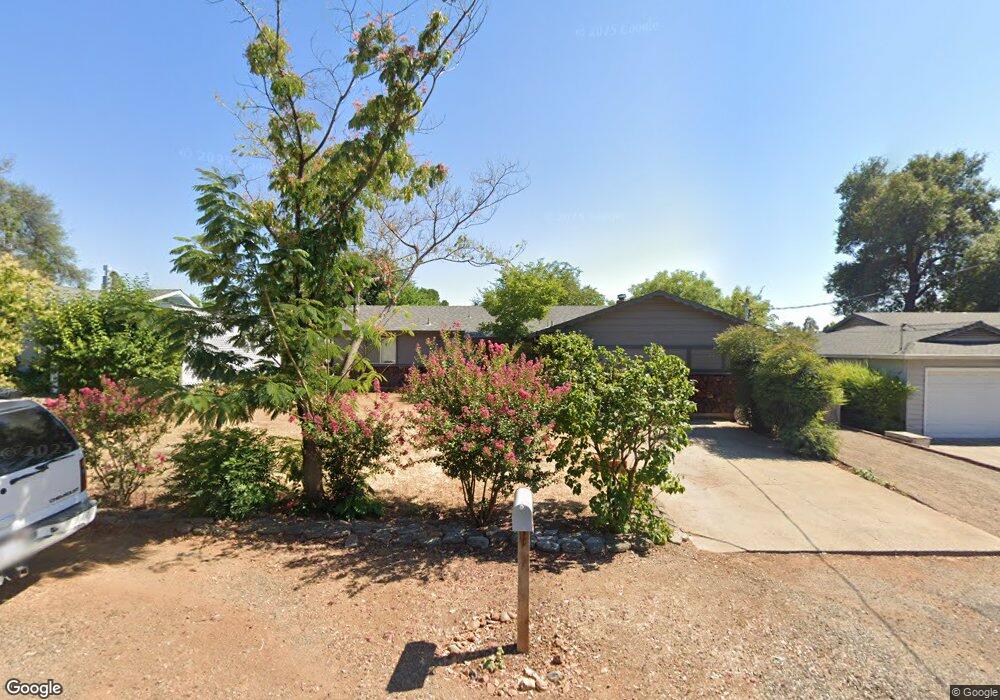
1159 de Moll Dr Redding, CA 96002
Enterprise NeighborhoodEstimated Value: $269,771 - $320,000
3
Beds
2
Baths
1,300
Sq Ft
$232/Sq Ft
Est. Value
About This Home
This home is located at 1159 de Moll Dr, Redding, CA 96002 and is currently estimated at $301,693, approximately $232 per square foot. 1159 de Moll Dr is a home located in Shasta County with nearby schools including Lassen View Elementary School, Parsons Junior High School, and Enterprise High School.
Ownership History
Date
Name
Owned For
Owner Type
Purchase Details
Closed on
Jul 26, 2000
Sold by
Trust Weis William H & Jeanne W Tr Weis F
Bought by
Herndon Karen S
Current Estimated Value
Home Financials for this Owner
Home Financials are based on the most recent Mortgage that was taken out on this home.
Original Mortgage
$82,905
Outstanding Balance
$29,848
Interest Rate
8.12%
Mortgage Type
FHA
Estimated Equity
$271,845
Create a Home Valuation Report for This Property
The Home Valuation Report is an in-depth analysis detailing your home's value as well as a comparison with similar homes in the area
Home Values in the Area
Average Home Value in this Area
Purchase History
| Date | Buyer | Sale Price | Title Company |
|---|---|---|---|
| Herndon Karen S | $84,000 | Alliance Title Company |
Source: Public Records
Mortgage History
| Date | Status | Borrower | Loan Amount |
|---|---|---|---|
| Open | Herndon Karen S | $82,905 |
Source: Public Records
Tax History
| Year | Tax Paid | Tax Assessment Tax Assessment Total Assessment is a certain percentage of the fair market value that is determined by local assessors to be the total taxable value of land and additions on the property. | Land | Improvement |
|---|---|---|---|---|
| 2025 | $1,322 | $126,550 | $33,138 | $93,412 |
| 2024 | $1,301 | $124,070 | $32,489 | $91,581 |
| 2023 | $1,301 | $121,638 | $31,852 | $89,786 |
| 2022 | $1,263 | $119,254 | $31,228 | $88,026 |
| 2021 | $1,219 | $116,916 | $30,616 | $86,300 |
| 2020 | $1,212 | $115,719 | $30,303 | $85,416 |
| 2019 | $1,201 | $113,451 | $29,709 | $83,742 |
| 2018 | $1,185 | $111,227 | $29,127 | $82,100 |
| 2017 | $1,204 | $109,047 | $28,556 | $80,491 |
| 2016 | $1,126 | $106,910 | $27,997 | $78,913 |
| 2015 | $1,115 | $105,305 | $27,577 | $77,728 |
| 2014 | $1,106 | $103,243 | $27,037 | $76,206 |
Source: Public Records
Map
Nearby Homes
- 4020 Churn Creek Rd
- 1354 Harpole Rd
- 3759 Alma Ave
- 1513 Harpole Rd
- 4323 Churn Crk Rd
- 4302 Paulson Ln
- 737 Estate St
- 1397 Empress Ln
- 751 Woodacre Dr
- 688 Julie Way
- 3527 Adams Ln
- 3708 Traverse St
- 3540 Ricardo Ave
- 3689 Suzanne Way
- 3360 Lawrence Rd
- 607 Woodacre Dr
- 1091 Del Sol Place
- 1289 Arizona St
- 1075 Le Brun Ln
- 3293 Middleton Ln
- 1179 Demol
- 1169 de Moll Dr
- 1119 de Moll Dr
- 1046 Monterra Ln
- 1179 de Moll Dr
- 1040 Monterra Ln
- 1101 de Moll Dr
- 1050 Monterra Ln
- 1036 Monterra Ln
- 1056 Monterra Ln
- 1132 de Moll Dr
- 1148 de Moll Dr
- 1189 de Moll Dr
- 1030 Monterra Ln
- 1085 de Moll Dr Unit 1
- 1085 de Moll Dr
- 1088 de Moll Dr
- 1116 de Moll Dr
- 1158 de Moll Dr
- 1060 Monterra Ln
Your Personal Tour Guide
Ask me questions while you tour the home.