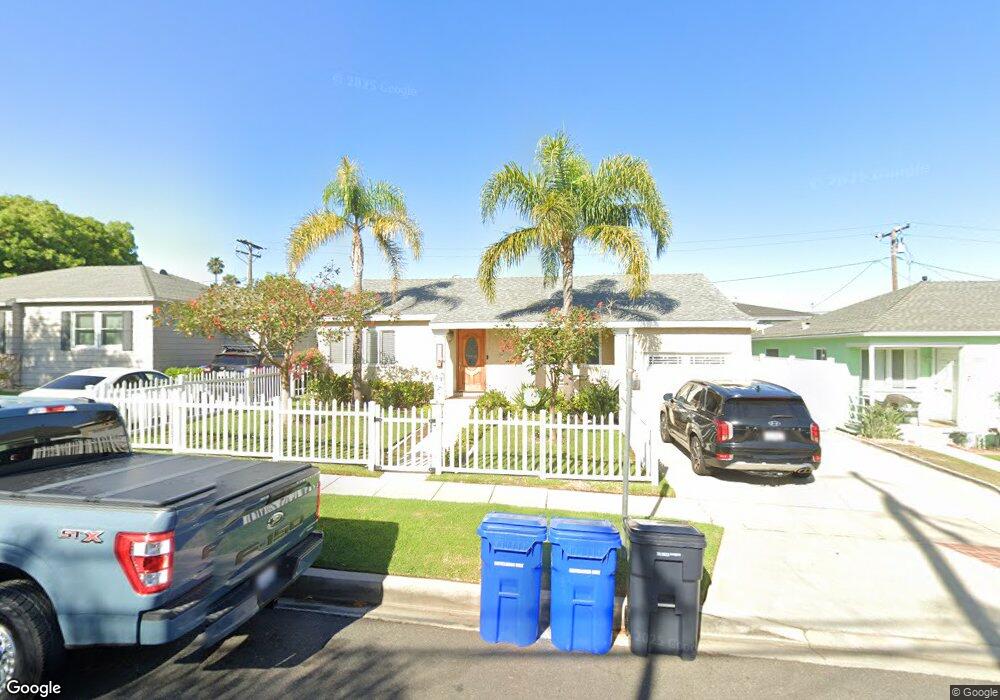
1159 Harkness St Manhattan Beach, CA 90266
Estimated Value: $1,945,151 - $2,633,000
3
Beds
2
Baths
2,450
Sq Ft
$945/Sq Ft
Est. Value
About This Home
Rent for this condition house would be $6,900 per month , the rent has been reduced to $6500 to rent it in September 2024.
Large remodeled 3 Bedrooms (could be used as 4 bedroom) , fresh paint throughout the house and has new windows installed, 2 full Baths, Family Room, Living Room, Dining Room, Master Bedroom, Fire Places, Central heating, Wooden Blinds, Wood floor, Refrigerator, Microwave, Dishwasher, Washer and Dryer, Large Storage space above the garage, Beautiful Private Back Yard with fruit trees.
Very close to the beach, freeways, parks, schools, and Metro station.
If you are looking for a 3 bedrooms house you have to see this house before you decide.
Ownership History
Date
Name
Owned For
Owner Type
Purchase Details
Closed on
Sep 29, 2021
Sold by
Danaei Shawn S
Bought by
Shawn S Danaei Family Trust and Danaei
Current Estimated Value
Purchase Details
Closed on
Jun 10, 1993
Sold by
Danaei Maryam
Bought by
Danaei Shawn S
Home Financials for this Owner
Home Financials are based on the most recent Mortgage that was taken out on this home.
Original Mortgage
$186,900
Interest Rate
6.85%
Create a Home Valuation Report for This Property
The Home Valuation Report is an in-depth analysis detailing your home's value as well as a comparison with similar homes in the area
Home Values in the Area
Average Home Value in this Area
Purchase History
| Date | Buyer | Sale Price | Title Company |
|---|---|---|---|
| Shawn S Danaei Family Trust | -- | None Listed On Document | |
| Danaei Shawn S | -- | Old Republic Title Company |
Source: Public Records
Mortgage History
| Date | Status | Borrower | Loan Amount |
|---|---|---|---|
| Previous Owner | Danaei Shawn S | $186,900 |
Source: Public Records
Property History
| Date | Event | Price | List to Sale | Price per Sq Ft |
|---|---|---|---|---|
| 10/22/2024 10/22/24 | Off Market | $6,500 | -- | -- |
| 10/08/2024 10/08/24 | Off Market | $6,500 | -- | -- |
| 09/19/2024 09/19/24 | For Rent | $6,500 | 0.0% | -- |
| 09/15/2024 09/15/24 | For Rent | $6,500 | -- | -- |
Tax History Compared to Growth
Tax History
| Year | Tax Paid | Tax Assessment Tax Assessment Total Assessment is a certain percentage of the fair market value that is determined by local assessors to be the total taxable value of land and additions on the property. | Land | Improvement |
|---|---|---|---|---|
| 2025 | $5,484 | $433,214 | $343,048 | $90,166 |
| 2024 | $5,484 | $424,721 | $336,322 | $88,399 |
| 2023 | $5,221 | $416,394 | $329,728 | $86,666 |
| 2022 | $5,139 | $408,230 | $323,263 | $84,967 |
| 2021 | $5,104 | $400,226 | $316,925 | $83,301 |
| 2019 | $4,977 | $388,357 | $307,526 | $80,831 |
| 2018 | $4,807 | $380,744 | $301,497 | $79,247 |
| 2016 | $4,300 | $365,962 | $289,791 | $76,171 |
| 2015 | $4,214 | $360,466 | $285,439 | $75,027 |
| 2014 | $4,167 | $353,406 | $279,848 | $73,558 |
Source: Public Records
Map
Nearby Homes
- 1760 9th St
- 1820 9th St
- 1816 9th St
- 1757 8th St
- 1833 8th St
- 2012 Manhattan Beach Blvd Unit 2
- 1534 Manhattan Beach Blvd
- 3202 Green Ln
- 1635 19th St
- 1716 6th St
- 1505 11th St
- 3310 Blossom Ln
- 2209 Faymont Ave
- 1440 12th St Unit C
- 1436 Manhattan Beach Blvd
- 1467 18th St
- 1643 3rd St
- 1421 12th St Unit 1
- 1706 2nd St
- 2700 Aviation Blvd
- 1155 Harkness St
- 1201 Harkness St
- 1158 Manzanita Ln
- 1205 Harkness St
- 1151 Harkness St
- 1154 Manzanita Ln
- 1200 Manzanita Ln
- 1804 12th St Unit 4
- 1802 12th St Unit 2
- 1204 Manzanita Ln
- 1150 Manzanita Ln
- 1801 5th St
- 1209 Harkness St
- 1801 Manhattan Beach Blvd
- 1801 - 1803 Manhattan Beach Blvd
- 1801 Manhattan Beach Blvd Unit 4
- 1801 Manhattan Beach Blvd Unit 2
- 1801 3rd St
- 1200 Harkness St
- 1208 Manzanita Ln