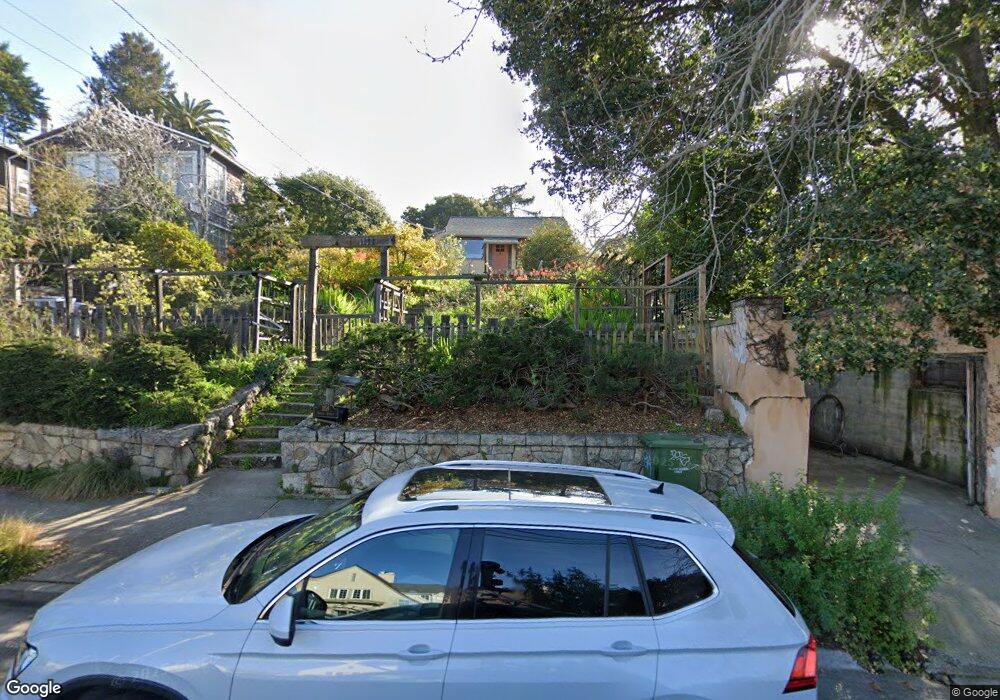
1159 Spruce St Berkeley, CA 94707
Berkeley Hills NeighborhoodEstimated Value: $1,249,841 - $1,504,000
2
Beds
1
Bath
992
Sq Ft
$1,332/Sq Ft
Est. Value
About This Home
This home is located at 1159 Spruce St, Berkeley, CA 94707 and is currently estimated at $1,321,210, approximately $1,331 per square foot. 1159 Spruce St is a home located in Alameda County with nearby schools including Cragmont Elementary School, Berkeley Arts Magnet at Whittier School, and Washington Elementary School.
Ownership History
Date
Name
Owned For
Owner Type
Purchase Details
Closed on
Nov 29, 2019
Sold by
Wendt Eric James and Wendt Mardawn Kisner
Bought by
Wendt Eric James and Wendt Mardawn Kisner
Current Estimated Value
Purchase Details
Closed on
Mar 29, 1999
Sold by
Chin Frederic K and Chin Carole L
Bought by
Wendt Eric J and Wendt Mardawn K
Home Financials for this Owner
Home Financials are based on the most recent Mortgage that was taken out on this home.
Original Mortgage
$229,450
Outstanding Balance
$57,907
Interest Rate
7%
Estimated Equity
$1,263,303
Purchase Details
Closed on
Jul 24, 1995
Sold by
Chin Lin T and Chin Lin Tai
Bought by
Chin Frederic K and Chin Carole L
Create a Home Valuation Report for This Property
The Home Valuation Report is an in-depth analysis detailing your home's value as well as a comparison with similar homes in the area
Home Values in the Area
Average Home Value in this Area
Purchase History
| Date | Buyer | Sale Price | Title Company |
|---|---|---|---|
| Wendt Eric James | -- | None Available | |
| Wendt Eric J | $255,000 | Nortwestern Title Company | |
| Chin Frederic K | -- | -- |
Source: Public Records
Mortgage History
| Date | Status | Borrower | Loan Amount |
|---|---|---|---|
| Open | Wendt Eric J | $229,450 |
Source: Public Records
Tax History
| Year | Tax Paid | Tax Assessment Tax Assessment Total Assessment is a certain percentage of the fair market value that is determined by local assessors to be the total taxable value of land and additions on the property. | Land | Improvement |
|---|---|---|---|---|
| 2025 | $7,227 | $392,742 | $119,922 | $279,820 |
| 2024 | $7,227 | $384,906 | $117,572 | $274,334 |
| 2023 | $7,059 | $384,223 | $115,267 | $268,956 |
| 2022 | $6,903 | $369,690 | $113,007 | $263,683 |
| 2021 | $6,896 | $362,305 | $110,791 | $258,514 |
| 2020 | $6,476 | $365,518 | $109,655 | $255,863 |
| 2019 | $6,162 | $358,353 | $107,506 | $250,847 |
| 2018 | $6,040 | $351,328 | $105,398 | $245,930 |
| 2017 | $5,805 | $344,440 | $103,332 | $241,108 |
| 2016 | $5,574 | $337,688 | $101,306 | $236,382 |
| 2015 | $5,492 | $332,616 | $99,785 | $232,831 |
| 2014 | $5,387 | $326,101 | $97,830 | $228,271 |
Source: Public Records
Map
Nearby Homes
- 2315 Eunice St
- 1136 Keith Ave
- 1106 Cragmont Ave
- 2501 Rose Walk
- 1471 Scenic Ave
- 1440 Walnut St Unit 5
- 2012 Rose St
- 826 Indian Rock Ave
- 1444 Walnut St
- 1024 Miller Ave
- 1165 Cragmont Ave
- 1519 Oxford St Unit E
- 1155 Keeler Ave
- 1110 Sterling Ave
- 1622 Scenic Ave
- 1425 Martin Luther King jr Way
- 982 Grizzly Peak Blvd
- 1119 Miller Ave
- 890 Keeler Ave
- 770 Santa Barbara Rd
Your Personal Tour Guide
Ask me questions while you tour the home.