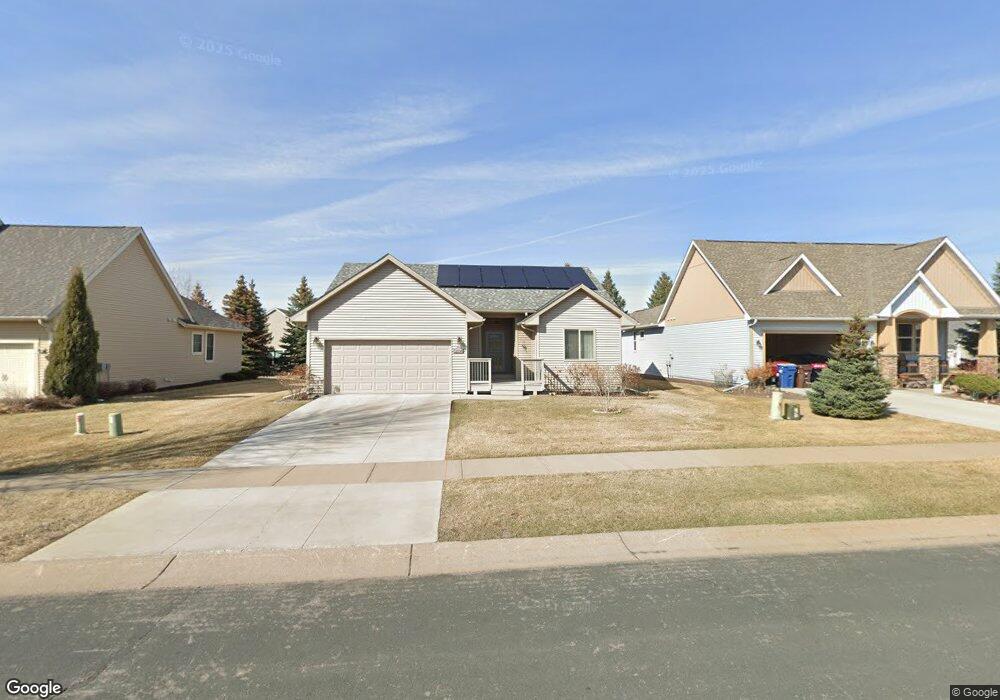
11594 84th Ave N Maple Grove, MN 55369
Estimated Value: $459,857 - $590,000
3
Beds
2
Baths
1,400
Sq Ft
$367/Sq Ft
Est. Value
About This Home
This home is located at 11594 84th Ave N, Maple Grove, MN 55369 and is currently estimated at $513,714, approximately $366 per square foot. 11594 84th Ave N is a home located in Hennepin County with nearby schools including Rice Lake Elementary School, Maple Grove Middle School, and Osseo Senior High School.
Ownership History
Date
Name
Owned For
Owner Type
Purchase Details
Closed on
Mar 31, 2021
Sold by
Lazarev Ivan and Lazarev Larisa
Bought by
Murman Gloria J and The Murman Living Trust
Current Estimated Value
Home Financials for this Owner
Home Financials are based on the most recent Mortgage that was taken out on this home.
Original Mortgage
$299,000
Outstanding Balance
$270,177
Interest Rate
3.05%
Mortgage Type
New Conventional
Estimated Equity
$243,537
Purchase Details
Closed on
May 30, 2017
Sold by
Tycoma Holdings Llc
Bought by
Lazarev Ivan and Lazarev Lairisa
Purchase Details
Closed on
Nov 17, 2015
Sold by
High Grove Llc
Bought by
Tycoma Holdings Llc
Purchase Details
Closed on
Jul 27, 2012
Sold by
Hearthstone Inc
Bought by
High Grove Llc
Purchase Details
Closed on
Nov 15, 2011
Sold by
Maple Grove Acres Inc
Bought by
The Rottlund Company Inc
Create a Home Valuation Report for This Property
The Home Valuation Report is an in-depth analysis detailing your home's value as well as a comparison with similar homes in the area
Home Values in the Area
Average Home Value in this Area
Purchase History
| Date | Buyer | Sale Price | Title Company |
|---|---|---|---|
| Murman Gloria J | $415,000 | Title Mark Llc | |
| Lazarev Ivan | $144,000 | Watermark Title Agency Llc | |
| Tycoma Holdings Llc | $120,000 | Watermark Title Agency | |
| High Grove Llc | $475,000 | Stewart Title Of Mn Inc | |
| The Rottlund Company Inc | $876,652 | Stewart Title Of Minnesota I |
Source: Public Records
Mortgage History
| Date | Status | Borrower | Loan Amount |
|---|---|---|---|
| Open | Murman Gloria J | $299,000 |
Source: Public Records
Tax History Compared to Growth
Tax History
| Year | Tax Paid | Tax Assessment Tax Assessment Total Assessment is a certain percentage of the fair market value that is determined by local assessors to be the total taxable value of land and additions on the property. | Land | Improvement |
|---|---|---|---|---|
| 2024 | $5,203 | $432,600 | $75,600 | $357,000 |
| 2023 | $5,268 | $448,700 | $84,700 | $364,000 |
| 2022 | $4,455 | $426,300 | $73,800 | $352,500 |
| 2021 | $4,511 | $369,600 | $76,100 | $293,500 |
| 2020 | $4,630 | $366,600 | $81,000 | $285,600 |
| 2019 | $4,623 | $360,100 | $89,800 | $270,300 |
| 2018 | $856 | $340,900 | $79,800 | $261,100 |
| 2017 | $1,584 | $90,000 | $90,000 | $0 |
| 2016 | $1,430 | $80,000 | $80,000 | $0 |
| 2015 | $1,470 | $80,000 | $80,000 | $0 |
| 2014 | -- | $60,000 | $60,000 | $0 |
Source: Public Records
Map
Nearby Homes
- 11712 84th Ave N Unit 309
- 8406 Jonquil Ln N
- 11601 82nd Ave N
- 11540 81st Place N
- 11486 81st Place N
- 11462 81st Place N
- 11879 85th Place N Unit 54
- 8154 Arrowwood Ln N
- 8704 Cottonwood Ln N
- 8764 Cottonwood Ln N
- 11631 88th Ave N
- 11537 88th Ave N
- 8864 Cottonwood Ln N
- 8025 Larch Ln N
- 11760 88th Place N
- 12598 84th Place N
- 8326 Oakview Ct N
- 14877 106th Ave N
- 12509 88th Ave N
- 12775 82nd Place N
- 11616 11616 84th-Avenue-n
- 11616 84th Ave N
- 11572 84th Ave N
- XXXXX 84th Place N
- 11593 84th Place N
- 11615 84th Place N
- 11571 84th Place N
- 11595 84th Ave N
- 11573 84th Ave N
- 11573 11573 84th-Avenue-n
- 8400 Deerwood Ln N
- 8400 8400 Deerwood-Lane-n
- 8412 Deerwood Ln N
- 8407 8407 Forestview-Lane-n
- 8403 8403 Forestview Ln N
- 8411 8411 Forestview-Lane-n
- 8409 Forestview Ln N
- 8411 Forestview Ln N Unit 206
- 8411 Forestview Ln N
- 8407 Forestview Ln N