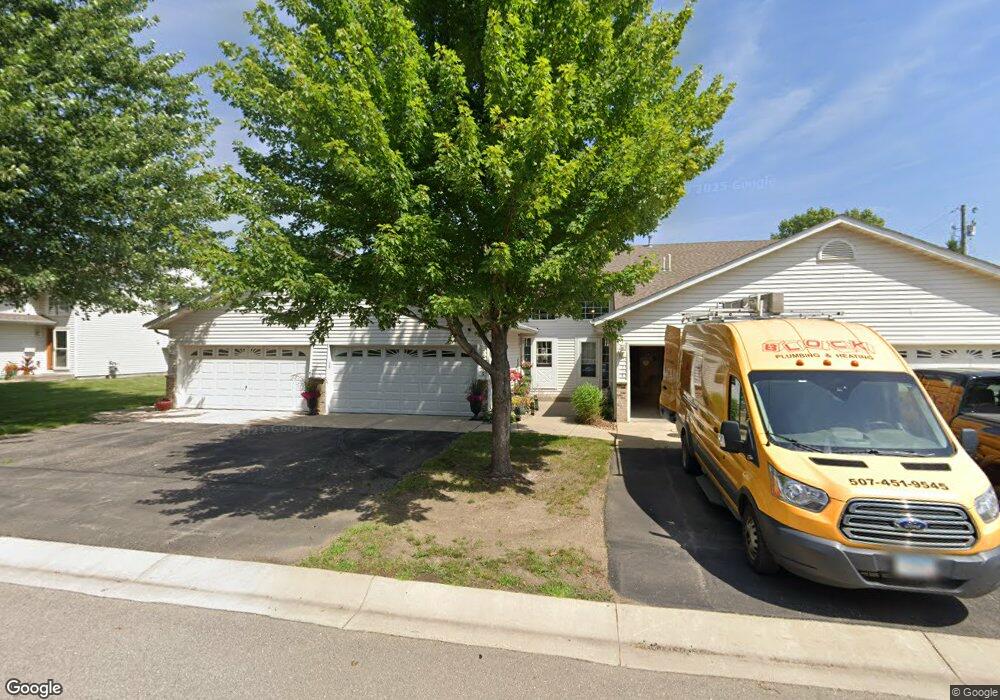
116 Cedar Cove Ln Owatonna, MN 55060
Estimated Value: $223,000 - $261,000
2
Beds
2
Baths
897
Sq Ft
$276/Sq Ft
Est. Value
About This Home
This home is located at 116 Cedar Cove Ln, Owatonna, MN 55060 and is currently estimated at $247,415, approximately $275 per square foot. 116 Cedar Cove Ln is a home located in Steele County with nearby schools including Wilson Elementary School, Owatonna Middle School, and Owatonna Senior High School.
Ownership History
Date
Name
Owned For
Owner Type
Purchase Details
Closed on
Jun 3, 2019
Sold by
Holm Cory L
Bought by
Feuerstein Gregg J
Current Estimated Value
Home Financials for this Owner
Home Financials are based on the most recent Mortgage that was taken out on this home.
Original Mortgage
$156,363
Outstanding Balance
$137,481
Interest Rate
4.1%
Mortgage Type
New Conventional
Estimated Equity
$109,934
Purchase Details
Closed on
Nov 12, 2010
Sold by
Homesales Inc
Bought by
Holm Lester Lyle
Home Financials for this Owner
Home Financials are based on the most recent Mortgage that was taken out on this home.
Original Mortgage
$80,000
Interest Rate
4.19%
Mortgage Type
VA
Purchase Details
Closed on
Feb 5, 2010
Sold by
Chase Home Finance Llc
Bought by
Homesales Inc
Purchase Details
Closed on
Jan 19, 2009
Sold by
Wieczoreak Joseph M and Wieczoreck Amy L
Bought by
Chase Manhattan Mortgage Corporation and Chase Home Finance Llc
Create a Home Valuation Report for This Property
The Home Valuation Report is an in-depth analysis detailing your home's value as well as a comparison with similar homes in the area
Home Values in the Area
Average Home Value in this Area
Purchase History
| Date | Buyer | Sale Price | Title Company |
|---|---|---|---|
| Feuerstein Gregg J | -- | None Available | |
| Holm Lester Lyle | $80,000 | Key Title Inc | |
| Homesales Inc | -- | None Available | |
| Chase Manhattan Mortgage Corporation | $110,500 | None Available |
Source: Public Records
Mortgage History
| Date | Status | Borrower | Loan Amount |
|---|---|---|---|
| Open | Feuerstein Gregg J | $156,363 | |
| Previous Owner | Holm Lester Lyle | $80,000 |
Source: Public Records
Tax History Compared to Growth
Tax History
| Year | Tax Paid | Tax Assessment Tax Assessment Total Assessment is a certain percentage of the fair market value that is determined by local assessors to be the total taxable value of land and additions on the property. | Land | Improvement |
|---|---|---|---|---|
| 2025 | $2,680 | $207,200 | $16,500 | $190,700 |
| 2024 | $2,932 | $201,400 | $16,500 | $184,900 |
| 2023 | $2,608 | $208,400 | $15,100 | $193,300 |
| 2022 | $2,278 | $180,800 | $14,300 | $166,500 |
| 2021 | $2,238 | $146,510 | $14,014 | $132,496 |
| 2020 | $2,180 | $142,688 | $14,014 | $128,674 |
| 2019 | $1,752 | $134,848 | $11,760 | $123,088 |
| 2018 | $1,668 | $118,972 | $11,760 | $107,212 |
| 2017 | $1,532 | $114,268 | $9,800 | $104,468 |
| 2016 | $1,466 | $107,604 | $9,800 | $97,804 |
| 2015 | -- | $0 | $0 | $0 |
| 2014 | -- | $0 | $0 | $0 |
Source: Public Records
Map
Nearby Homes
- 140 Cedar Cove Ln
- 160 26th St NW
- 151 22nd St NW
- 330 Arglen Dr
- TBD Landmark Dr NE
- xxx Landmark Dr NE
- 2126 3rd Ave NW Unit 62
- 2126 3rd Ave NW Unit 80
- 410 23rd St NW
- 170 Valleyview Place
- 146 19th St NE
- TBD Breckenridge Place
- 2115 3rd Ave NE
- 2520 Lamada Place
- 2834 Meadowview Ln NE
- 375 Breckenridge Place
- 2882 Meadowview Ln NE
- 475 Willow Creek Dr
- 320 16th St NE
- 1515 3rd Ave NE
- 114 Cedar Cove Ln
- 120 Cedar Cove Ln
- 110 Cedar Cove Ln
- 126 Cedar Cove Ln
- 128 Cedar Cove Ln
- 132 Cedar Cove Ln
- 2442 N Cedar Ave
- 134 Cedar Cove Ln
- 2440 N Cedar Ave
- 144 Cedar Cove Ln
- 146 Cedar Cove Ln
- 146 146 Cedar Covenw
- 143 Cedar Cove Ln
- 156 Cedar Cove Ln
- 150 Cedar Cove Ln
- 158 Cedar Cove Ln
- 147 Cedar Cove Ln
- 162 Cedar Cove Ln
- 153 Cedar Cove Ln
- 164 Cedar Cove Ln