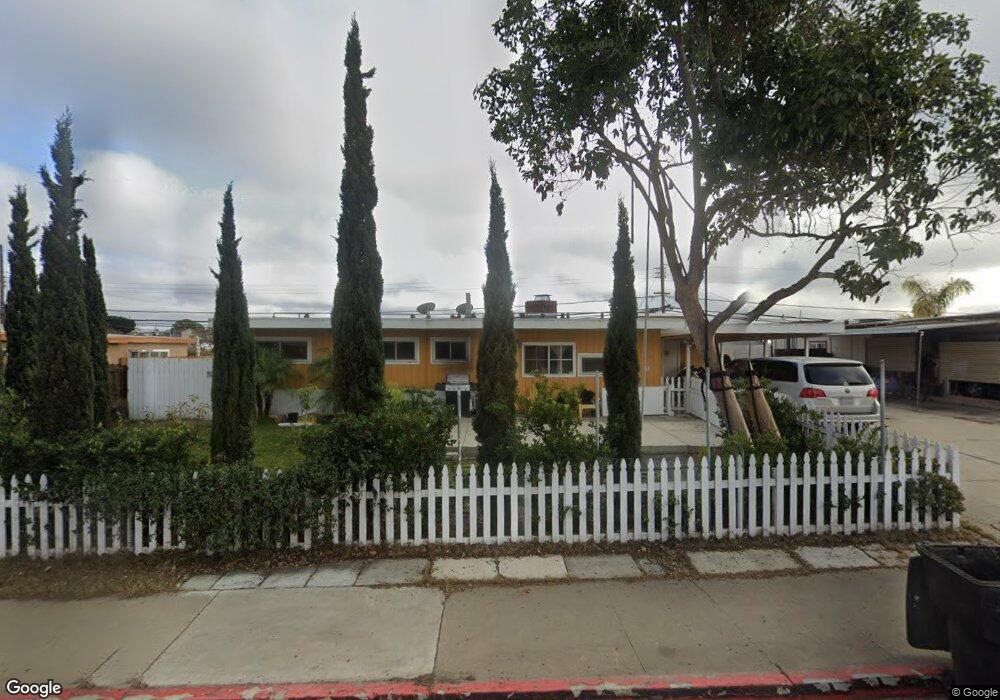
116 E L St Chula Vista, CA 91911
Castle Park NeighborhoodEstimated Value: $667,000 - $770,000
3
Beds
2
Baths
1,050
Sq Ft
$685/Sq Ft
Est. Value
About This Home
This home is located at 116 E L St, Chula Vista, CA 91911 and is currently estimated at $719,745, approximately $685 per square foot. 116 E L St is a home located in San Diego County with nearby schools including Cook Elementary School, Hilltop Middle School, and Hilltop Senior High School.
Ownership History
Date
Name
Owned For
Owner Type
Purchase Details
Closed on
May 8, 2017
Sold by
Sanchez Jorge and Sanchez Karla
Bought by
Lopez Jesus B and Arneson Rhonda J
Current Estimated Value
Home Financials for this Owner
Home Financials are based on the most recent Mortgage that was taken out on this home.
Original Mortgage
$402,573
Outstanding Balance
$332,656
Interest Rate
3.87%
Mortgage Type
FHA
Estimated Equity
$387,089
Purchase Details
Closed on
Apr 2, 2014
Sold by
Fannie Mae
Bought by
Sanchez Jorge and Sanchez Karla
Purchase Details
Closed on
Aug 1, 2013
Sold by
Oliver Patricia B
Bought by
Federal National Mortgage Association
Purchase Details
Closed on
May 12, 1997
Sold by
Oliver Thomas E and Oliver Patricia B
Bought by
The Oliver Family Trust and Oliver Thomas Emory
Create a Home Valuation Report for This Property
The Home Valuation Report is an in-depth analysis detailing your home's value as well as a comparison with similar homes in the area
Home Values in the Area
Average Home Value in this Area
Purchase History
| Date | Buyer | Sale Price | Title Company |
|---|---|---|---|
| Lopez Jesus B | $410,000 | Ticor Title San Diego | |
| Sanchez Jorge | $255,000 | Wfg Title Company Of Ca | |
| Federal National Mortgage Association | $301,364 | Accommodation | |
| The Oliver Family Trust | -- | -- |
Source: Public Records
Mortgage History
| Date | Status | Borrower | Loan Amount |
|---|---|---|---|
| Open | Lopez Jesus B | $402,573 |
Source: Public Records
Tax History
| Year | Tax Paid | Tax Assessment Tax Assessment Total Assessment is a certain percentage of the fair market value that is determined by local assessors to be the total taxable value of land and additions on the property. | Land | Improvement |
|---|---|---|---|---|
| 2025 | $5,487 | $475,833 | $417,807 | $58,026 |
| 2024 | $5,487 | $466,504 | $409,615 | $56,889 |
| 2023 | $5,412 | $457,358 | $401,584 | $55,774 |
| 2022 | $5,257 | $448,391 | $393,710 | $54,681 |
| 2021 | $5,136 | $439,600 | $385,991 | $53,609 |
| 2020 | $5,013 | $435,094 | $382,034 | $53,060 |
| 2019 | $4,884 | $426,564 | $374,544 | $52,020 |
| 2018 | $4,808 | $418,200 | $367,200 | $51,000 |
| 2017 | $3,103 | $269,340 | $179,560 | $89,780 |
| 2016 | $3,031 | $264,060 | $176,040 | $88,020 |
| 2015 | $2,988 | $260,094 | $173,396 | $86,698 |
| 2014 | $2,978 | $249,696 | $166,464 | $83,232 |
Source: Public Records
Map
Nearby Homes
- 158 E L St
- 927 Agua Tibia Ave
- 1017 Helix Ave
- 1027 Guatay Ave
- 902 Monterey Ct
- 75 E Naples St
- 202 E J St
- 112 Country Club Dr
- 232 E Naples St
- 859 Tamayo Dr Unit 2
- 835 Tamayo Dr Unit 6
- 814 Tamayo Dr Unit 2
- 1144 Dixon Dr
- 500 Telegraph Canyon Rd Unit H
- 586 88 Roosevelt St
- 1261 Helix Ave
- 600 Sheffield Ct Unit 23
- 268 Sierra Way
- 1236 Tobias Dr
- 1040 2nd Ave
Your Personal Tour Guide
Ask me questions while you tour the home.