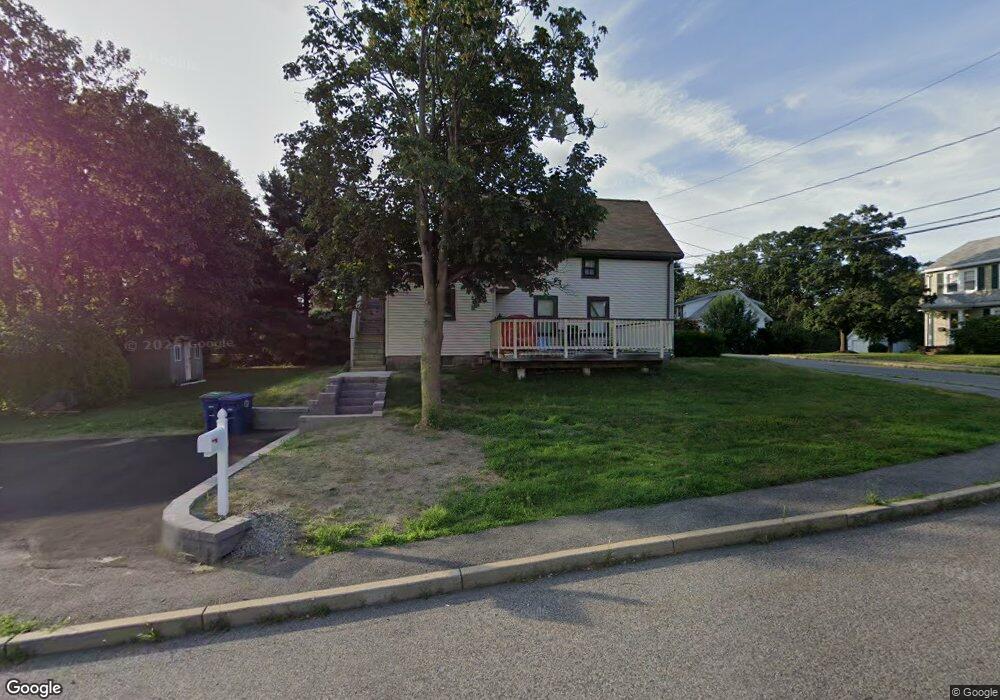
116 Hobart St Braintree, MA 02184
East Braintree NeighborhoodEstimated Value: $677,449 - $794,000
4
Beds
2
Baths
1,557
Sq Ft
$480/Sq Ft
Est. Value
About This Home
This home is located at 116 Hobart St, Braintree, MA 02184 and is currently estimated at $747,612, approximately $480 per square foot. 116 Hobart St is a home located in Norfolk County with nearby schools including Braintree High School, Sacred Heart Elementary School, and South Shore Christian Academy.
Ownership History
Date
Name
Owned For
Owner Type
Purchase Details
Closed on
Nov 1, 2000
Sold by
Grant John J and Grant Lisa E
Bought by
Matheny Joseph A
Current Estimated Value
Home Financials for this Owner
Home Financials are based on the most recent Mortgage that was taken out on this home.
Original Mortgage
$189,600
Outstanding Balance
$69,615
Interest Rate
7.83%
Mortgage Type
Purchase Money Mortgage
Estimated Equity
$677,997
Create a Home Valuation Report for This Property
The Home Valuation Report is an in-depth analysis detailing your home's value as well as a comparison with similar homes in the area
Home Values in the Area
Average Home Value in this Area
Purchase History
| Date | Buyer | Sale Price | Title Company |
|---|---|---|---|
| Matheny Joseph A | $237,000 | -- |
Source: Public Records
Mortgage History
| Date | Status | Borrower | Loan Amount |
|---|---|---|---|
| Open | Matheny Joseph A | $189,600 |
Source: Public Records
Tax History Compared to Growth
Tax History
| Year | Tax Paid | Tax Assessment Tax Assessment Total Assessment is a certain percentage of the fair market value that is determined by local assessors to be the total taxable value of land and additions on the property. | Land | Improvement |
|---|---|---|---|---|
| 2025 | $6,329 | $634,200 | $349,100 | $285,100 |
| 2024 | $5,726 | $604,000 | $325,500 | $278,500 |
| 2023 | $5,387 | $551,900 | $292,500 | $259,400 |
| 2022 | $5,210 | $523,600 | $264,200 | $259,400 |
| 2021 | $4,956 | $498,100 | $238,700 | $259,400 |
| 2020 | $4,520 | $458,400 | $217,000 | $241,400 |
| 2019 | $4,247 | $420,900 | $207,600 | $213,300 |
| 2018 | $4,142 | $393,000 | $188,700 | $204,300 |
| 2017 | $3,914 | $364,400 | $179,300 | $185,100 |
| 2016 | $3,481 | $317,000 | $151,000 | $166,000 |
| 2015 | $3,488 | $315,100 | $149,100 | $166,000 |
| 2014 | $3,287 | $287,800 | $135,900 | $151,900 |
Source: Public Records
Map
Nearby Homes
- 141 Hobart St
- 159 Hobart St
- 74 Magnolia St
- 312 Shaw St
- 67 Somerville Ave
- 125 Allen St Unit A
- 9 Hillside Ave
- 141 Commercial St Unit 9
- 10 Skyline Dr Unit 5
- 51 Faxon St
- 1 Pantano St
- 30 Skyline Dr Unit 6
- 41 Lantern Ln
- 37 Lantern Ln
- 25 W Howard St Unit D2
- 15 Bower Rd Unit B5
- 15 Bower Rd Unit B2
- 116 Gordon Rd
- 129 Audubon Ave
- 124 Louise Rd