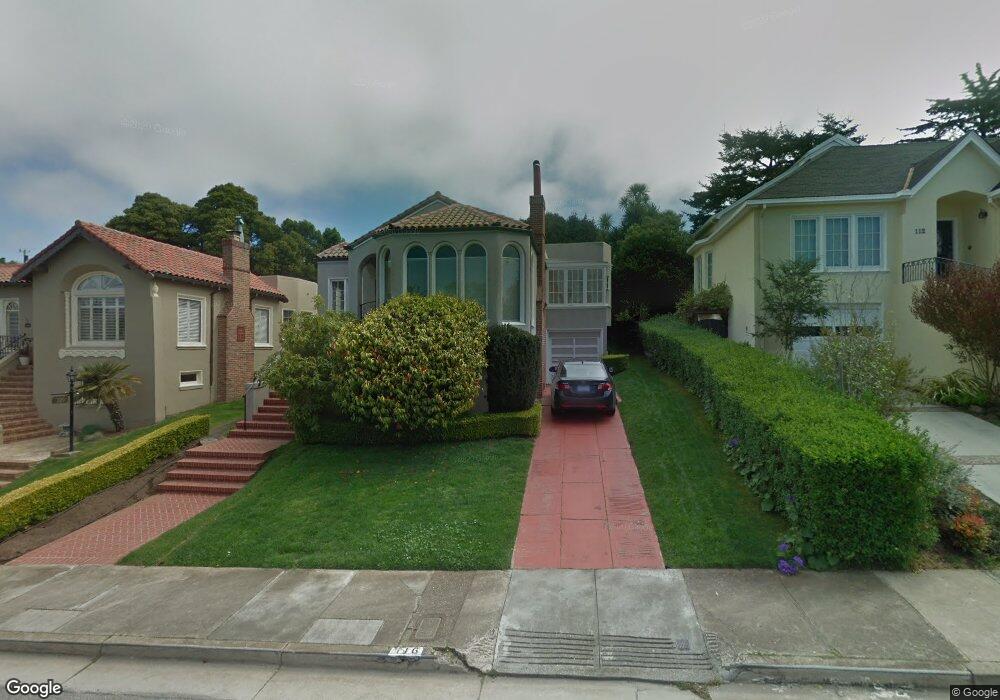
116 Lunado Way San Francisco, CA 94127
Ingleside Terrace NeighborhoodEstimated Value: $1,410,000 - $1,937,000
3
Beds
2
Baths
1,250
Sq Ft
$1,391/Sq Ft
Est. Value
About This Home
This home is located at 116 Lunado Way, San Francisco, CA 94127 and is currently estimated at $1,738,882, approximately $1,391 per square foot. 116 Lunado Way is a home located in San Francisco County with nearby schools including Commodore Sloat Elementary School, Aptos Middle School, and St. Stephen School.
Ownership History
Date
Name
Owned For
Owner Type
Purchase Details
Closed on
Jun 1, 2012
Sold by
Kaplan Jeffrey L and Kaplan Katherine A
Bought by
Yeh Melinda Jean and Yeh Hurjye
Current Estimated Value
Purchase Details
Closed on
May 17, 1999
Sold by
Stern Charles M and Stern Liese Loon
Bought by
Kaplan Jeffrey L and Kaplan Katherine A
Create a Home Valuation Report for This Property
The Home Valuation Report is an in-depth analysis detailing your home's value as well as a comparison with similar homes in the area
Home Values in the Area
Average Home Value in this Area
Purchase History
| Date | Buyer | Sale Price | Title Company |
|---|---|---|---|
| Yeh Melinda Jean | $960,000 | Fidelity National Title Co | |
| Kaplan Jeffrey L | $538,000 | Fidelity National Title Co | |
| Stern Charles M | -- | Fidelity National Title Co |
Source: Public Records
Tax History Compared to Growth
Tax History
| Year | Tax Paid | Tax Assessment Tax Assessment Total Assessment is a certain percentage of the fair market value that is determined by local assessors to be the total taxable value of land and additions on the property. | Land | Improvement |
|---|---|---|---|---|
| 2025 | $14,555 | $1,205,768 | $844,049 | $361,719 |
| 2024 | $14,555 | $1,182,128 | $827,501 | $354,627 |
| 2023 | $14,332 | $1,158,953 | $811,277 | $347,676 |
| 2022 | $14,055 | $1,136,231 | $795,371 | $340,860 |
| 2021 | $13,803 | $1,113,956 | $779,777 | $334,179 |
| 2020 | $13,870 | $1,102,535 | $771,782 | $330,753 |
| 2019 | $13,394 | $1,080,920 | $756,650 | $324,270 |
| 2018 | $12,940 | $1,059,618 | $741,738 | $317,880 |
| 2017 | $12,488 | $1,038,846 | $727,197 | $311,649 |
| 2016 | $12,279 | $1,018,482 | $712,941 | $305,541 |
| 2015 | $12,126 | $1,003,188 | $702,234 | $300,954 |
| 2014 | $11,806 | $983,538 | $688,479 | $295,059 |
Source: Public Records
Map
Nearby Homes