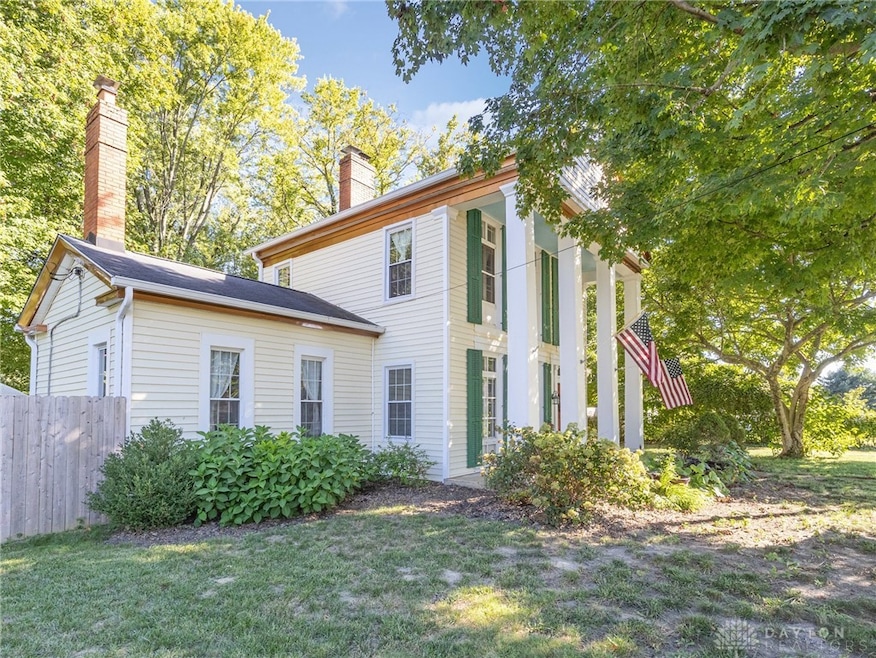
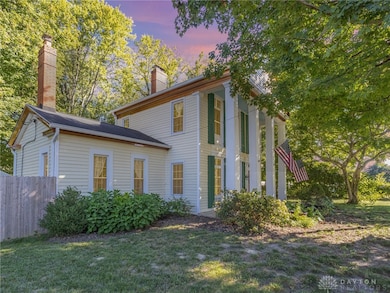
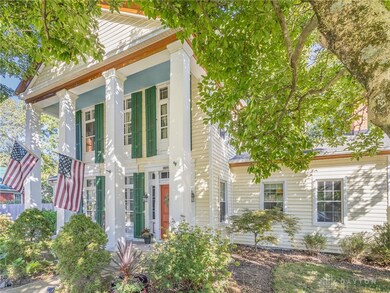
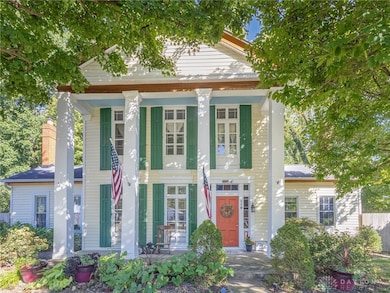
116 Maple St Harveysburg, OH 45032
Massie Township NeighborhoodEstimated payment $2,024/month
Highlights
- Wood Burning Stove
- Porch
- Patio
- No HOA
- Crown Molding
- Bathroom on Main Level
About This Home
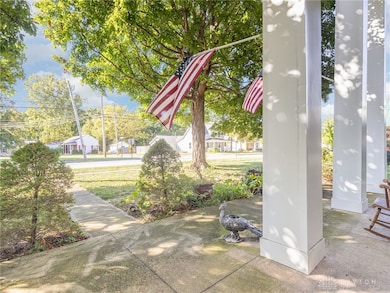
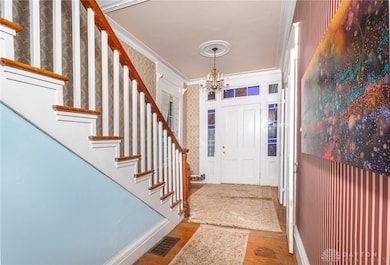
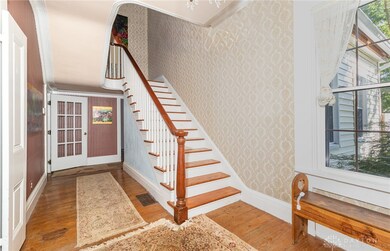
Welcome to this charming historical home in the heart of Harveysburg! Built in 1850 and once part of the Underground Railroad, this 3-bedroom, 2-bath home blends rich history with modern comfort. Inside you'll find original hardwood floors, crown molding, a grand stairway, stained glass windows, French doors, and even an oil chandelier in the formal dining room. The updated kitchen flows into open living spaces filled with natural light, while outside you'll enjoy a large backyard and a beautiful magnolia tree. Recent updates include new siding and gutters (2023). Nestled in the village by Caesar Creek Lake, the home offers easy access to I-71, nearby parks, charming festivals, and local farms. Small-town charm meets modern convenience don't miss your chance to own a piece of history!
Listing Agent
RE/MAX United Associates Brokerage Phone: (513) 655-2300 License #2014003562 Listed on: 10/16/2025

Home Details
Home Type
- Single Family
Est. Annual Taxes
- $3,112
Year Built
- 1850
Lot Details
- 0.45 Acre Lot
Parking
- No Garage
Home Design
- Vinyl Siding
Interior Spaces
- 2,704 Sq Ft Home
- 2-Story Property
- Crown Molding
- Wood Burning Stove
- Self Contained Fireplace Unit Or Insert
- Vinyl Clad Windows
- Insulated Windows
- Aluminum Window Frames
- Partial Basement
- Range
Bedrooms and Bathrooms
- 3 Bedrooms
- Bathroom on Main Level
- 2 Full Bathrooms
Laundry
- Dryer
- Washer
Outdoor Features
- Patio
- Porch
Utilities
- Central Air
- Heat Pump System
- Electric Water Heater
Community Details
- No Home Owners Association
- Village/Harveysburg Subdivision
Listing and Financial Details
- Assessor Parcel Number 10174030010
Map
Home Values in the Area
Average Home Value in this Area
Tax History
| Year | Tax Paid | Tax Assessment Tax Assessment Total Assessment is a certain percentage of the fair market value that is determined by local assessors to be the total taxable value of land and additions on the property. | Land | Improvement |
|---|---|---|---|---|
| 2024 | $3,112 | $95,850 | $13,600 | $82,250 |
| 2023 | $2,642 | $79,422 | $6,688 | $72,733 |
| 2022 | $1,790 | $51,139 | $6,689 | $44,450 |
| 2021 | $1,639 | $51,139 | $6,689 | $44,450 |
| 2020 | $1,554 | $41,577 | $5,439 | $36,138 |
| 2019 | $1,475 | $41,577 | $5,439 | $36,138 |
| 2018 | $1,565 | $41,577 | $5,439 | $36,138 |
| 2017 | $1,441 | $37,149 | $4,942 | $32,207 |
| 2016 | $1,486 | $37,149 | $4,942 | $32,207 |
| 2015 | $1,485 | $37,149 | $4,942 | $32,207 |
| 2014 | $1,407 | $33,770 | $4,490 | $29,280 |
| 2013 | $1,440 | $40,860 | $5,440 | $35,420 |
Property History
| Date | Event | Price | List to Sale | Price per Sq Ft |
|---|---|---|---|---|
| 10/27/2025 10/27/25 | Pending | -- | -- | -- |
| 10/16/2025 10/16/25 | For Sale | $335,000 | -4.3% | $124 / Sq Ft |
| 09/29/2025 09/29/25 | Price Changed | $350,000 | -5.4% | $129 / Sq Ft |
| 09/23/2025 09/23/25 | Price Changed | $370,000 | -2.6% | $137 / Sq Ft |
| 09/01/2025 09/01/25 | For Sale | $380,000 | -- | $141 / Sq Ft |
Purchase History
| Date | Type | Sale Price | Title Company |
|---|---|---|---|
| Warranty Deed | $320,000 | None Listed On Document | |
| Deed | $127,000 | -- | |
| Deed | $78,500 | -- | |
| Deed | $60,000 | -- | |
| Deed | $50,000 | -- |
Mortgage History
| Date | Status | Loan Amount | Loan Type |
|---|---|---|---|
| Open | $256,000 | New Conventional | |
| Previous Owner | $129,540 | VA |
Source: Dayton REALTORS®
MLS Number: 945863
APN: 10-17-403-001
Disclaimer: Certain information contained herein is derived from information provided by parties other than Homes.com. All information provided is deemed reliable, but is not guaranteed to be accurate and should be independently verified.
![]() The information is being provided by Dayton Area Board of Realtors MLS. Information deemed reliable but not guaranteed. Information is provided for the consumer's personal, non-commercial use, and may not be used for any purpose other than the identification of potential properties for purchase. Copyright 2025 Dayton Area Board of Realtors MLS. All Rights Reserved.
The information is being provided by Dayton Area Board of Realtors MLS. Information deemed reliable but not guaranteed. Information is provided for the consumer's personal, non-commercial use, and may not be used for any purpose other than the identification of potential properties for purchase. Copyright 2025 Dayton Area Board of Realtors MLS. All Rights Reserved.
- 291 Main St
- 10031 Ohio 73
- 105 Shepherds Ridge
- 5327 Harveysburg Rd
- 10311 Amherst Dr
- 10306 Amherst Dr
- 4245 Harveysburg Rd
- 9 Cumberland Ct
- 6794 Sun Ridge Way
- 6363 Trillium Dr
- 0 Trillium Dr Unit 943456
- 8648 Compton Rd
- 6722 Gard Rd
- 7902 N US Rt 42
- 6329 State Route 380
- 127 New Burlington Rd
- 9052 Wilson Rd
- 4 Corwin Rd
- 26 Country Lakes Blvd
- 10 Country Lakes Blvd