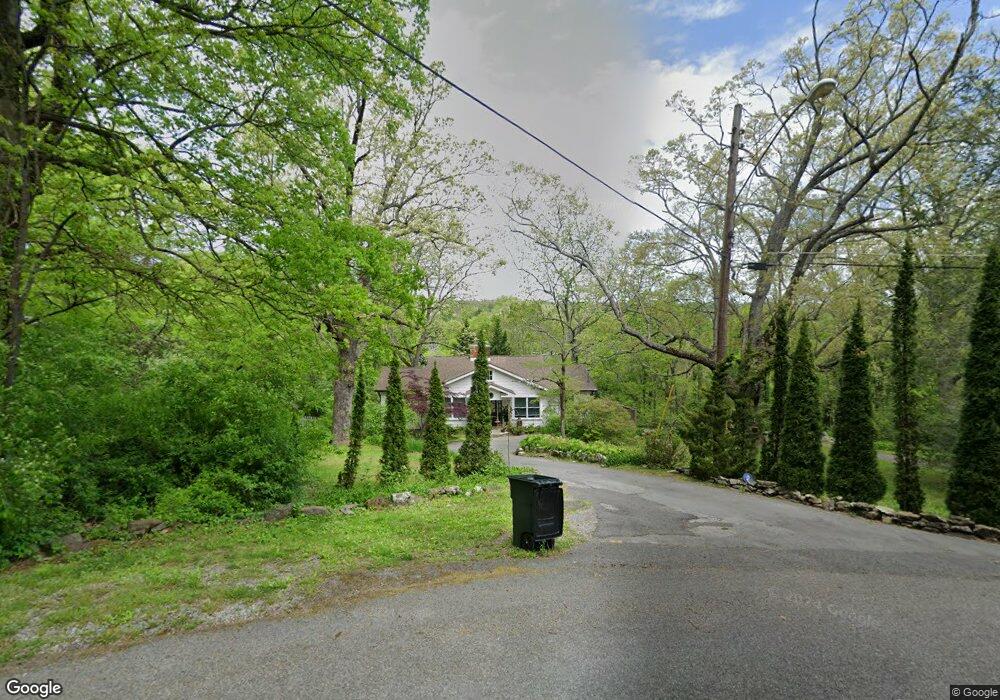
116 Mitchell Dr Lookout Mountain, TN 37350
Lookout Mountain NeighborhoodEstimated Value: $633,000 - $843,000
3
Beds
3
Baths
1,955
Sq Ft
$385/Sq Ft
Est. Value
About This Home
This home is located at 116 Mitchell Dr, Lookout Mountain, TN 37350 and is currently estimated at $752,781, approximately $385 per square foot. 116 Mitchell Dr is a home located in Hamilton County with nearby schools including Lookout Mountain Elementary School, Lookout Valley Middle/High School, and Chattanooga Christian School.
Ownership History
Date
Name
Owned For
Owner Type
Purchase Details
Closed on
May 17, 2017
Sold by
Wilde Cornel W
Bought by
Behm Kristen K
Current Estimated Value
Purchase Details
Closed on
Feb 15, 2008
Sold by
Arnsdorff Stephen C and Arnsdorff Margaret Leland Gentry
Bought by
Behm Kristen K and Wilde Cornel W
Home Financials for this Owner
Home Financials are based on the most recent Mortgage that was taken out on this home.
Original Mortgage
$140,000
Interest Rate
5.85%
Mortgage Type
Purchase Money Mortgage
Purchase Details
Closed on
Aug 8, 2001
Sold by
Arnsdorff Stephen C
Bought by
Arnsdorff Margaret Leland Gentry
Purchase Details
Closed on
Jan 14, 2000
Sold by
Christine Barrows Shirley K Barrows M
Bought by
Arnsdorff Stephen C
Home Financials for this Owner
Home Financials are based on the most recent Mortgage that was taken out on this home.
Original Mortgage
$150,000
Interest Rate
7.87%
Create a Home Valuation Report for This Property
The Home Valuation Report is an in-depth analysis detailing your home's value as well as a comparison with similar homes in the area
Home Values in the Area
Average Home Value in this Area
Purchase History
| Date | Buyer | Sale Price | Title Company |
|---|---|---|---|
| Behm Kristen K | -- | None Available | |
| Behm Kristen K | $340,000 | Legal Title | |
| Arnsdorff Margaret Leland Gentry | -- | -- | |
| Arnsdorff Stephen C | $149,500 | -- |
Source: Public Records
Mortgage History
| Date | Status | Borrower | Loan Amount |
|---|---|---|---|
| Previous Owner | Behm Kristen K | $140,000 | |
| Previous Owner | Arnsdorff Stephen C | $150,000 |
Source: Public Records
Tax History
| Year | Tax Paid | Tax Assessment Tax Assessment Total Assessment is a certain percentage of the fair market value that is determined by local assessors to be the total taxable value of land and additions on the property. | Land | Improvement |
|---|---|---|---|---|
| 2025 | $1,933 | $127,550 | $0 | $0 |
| 2024 | $2,424 | $108,325 | $0 | $0 |
| 2023 | $2,433 | $108,325 | $0 | $0 |
| 2022 | $2,433 | $108,325 | $0 | $0 |
| 2021 | $2,433 | $108,325 | $0 | $0 |
| 2020 | $2,659 | $95,850 | $0 | $0 |
| 2019 | $2,659 | $95,850 | $0 | $0 |
| 2018 | $2,659 | $95,850 | $0 | $0 |
| 2017 | $2,659 | $95,850 | $0 | $0 |
| 2016 | $2,398 | $0 | $0 | $0 |
| 2015 | $2,398 | $86,400 | $0 | $0 |
| 2014 | $2,398 | $0 | $0 | $0 |
Source: Public Records
Map
Nearby Homes
- 1007 Evanwood Dr
- 118 Fleetwood Dr
- 105 N Forrest Ave
- 106 Sunset Cir
- 307 Park Rd
- 0 Tinker Bell Cir Unit 1510010
- 0 Tinker Bell Cir Unit LOT 27 10563269
- 0 W 46th St Unit 1527436
- 185 Gnome Trail
- 557 Winterview Ln Unit 521H
- 710 W Brow Rd
- 5706 Pumpkin Pie Ln
- 1117 Mountain Terrace
- 1609 W 51st St
- 5405 Saint Elmo Ave
- 5411 Saint Elmo Ave
- 5719 Saint Elmo Ave
- 5310 Alabama Ave
- 1212 Cinderella Rd
- 5501 Beulah Ave
- 122 Mitchell Dr
- 1006 Evanwood Dr
- 117 Crandall Ave
- 124 Mitchell Dr
- 114 Mitchell Dr
- 1004 Evanwood Dr
- 128 Mitchell Dr
- 126 Mitchell Dr
- 113 Crandall Ave
- 119 Mitchell Dr
- 1008 Evanwood Dr
- 110 Mitchell Dr
- 1003 Evanwood Dr
- 123 Mitchell Dr
- 111 Crandall Ave
- 108 Crandall Ave
- 124 S Bragg Ave
- 403 E and Rd W
- 1002 Evanwood Dr
- 127 East and West Rd
Your Personal Tour Guide
Ask me questions while you tour the home.