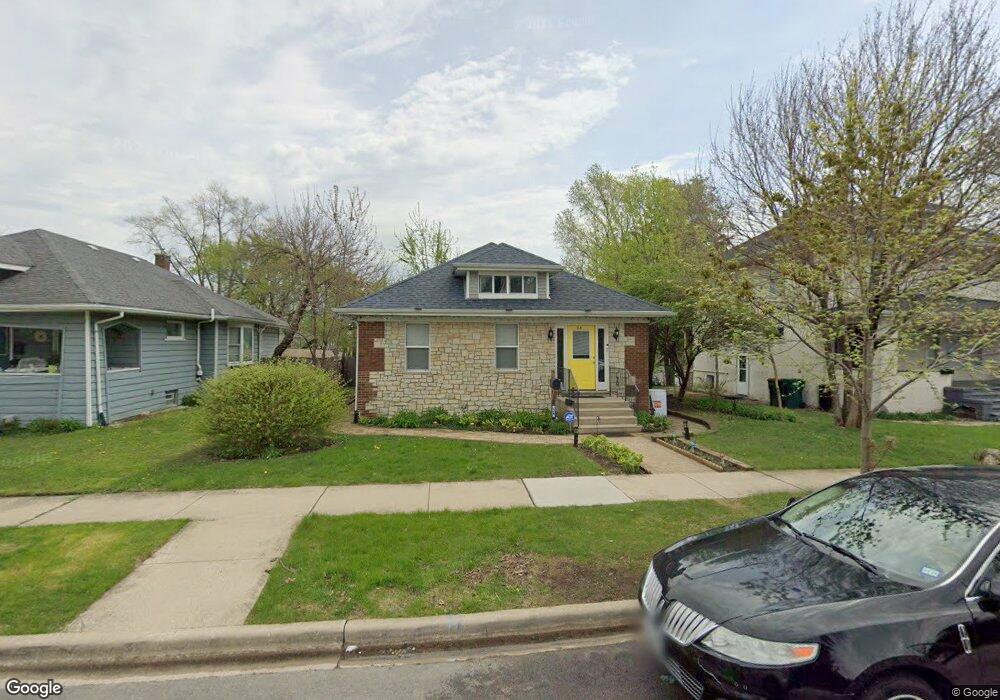
116 Seeser St Unit 1 Joliet, IL 60436
Saint Pat's NeighborhoodEstimated Value: $254,000 - $290,908
2
Beds
2
Baths
960
Sq Ft
$287/Sq Ft
Est. Value
About This Home
This home is located at 116 Seeser St Unit 1, Joliet, IL 60436 and is currently estimated at $275,227, approximately $286 per square foot. 116 Seeser St Unit 1 is a home located in Will County with nearby schools including Pershing Elementary School, Dirksen Junior High School, and Joliet Central High School.
Ownership History
Date
Name
Owned For
Owner Type
Purchase Details
Closed on
Aug 26, 2024
Sold by
Leon Agustin Meza
Bought by
Chavez Daniel
Current Estimated Value
Home Financials for this Owner
Home Financials are based on the most recent Mortgage that was taken out on this home.
Original Mortgage
$13,650
Outstanding Balance
$13,341
Interest Rate
2.5%
Estimated Equity
$261,886
Purchase Details
Closed on
Nov 8, 2016
Sold by
U S Bank National Association
Bought by
Meza Agustin
Purchase Details
Closed on
Sep 25, 2015
Sold by
Johnson James M and Case 2015 Ch 00019
Bought by
U S Bank National Association
Purchase Details
Closed on
Aug 13, 2015
Sold by
Johnson James M and Case #15 Ch 019
Bought by
U S Bank National Association
Create a Home Valuation Report for This Property
The Home Valuation Report is an in-depth analysis detailing your home's value as well as a comparison with similar homes in the area
Home Values in the Area
Average Home Value in this Area
Purchase History
| Date | Buyer | Sale Price | Title Company |
|---|---|---|---|
| Chavez Daniel | $273,000 | Fidelity National Title | |
| Meza Agustin | $55,684 | Attorney | |
| U S Bank National Association | -- | Attorney | |
| U S Bank National Association | $41,360 | Attorney |
Source: Public Records
Mortgage History
| Date | Status | Borrower | Loan Amount |
|---|---|---|---|
| Open | Chavez Daniel | $13,650 | |
| Open | Chavez Daniel | $268,055 |
Source: Public Records
Tax History Compared to Growth
Tax History
| Year | Tax Paid | Tax Assessment Tax Assessment Total Assessment is a certain percentage of the fair market value that is determined by local assessors to be the total taxable value of land and additions on the property. | Land | Improvement |
|---|---|---|---|---|
| 2024 | $4,399 | $60,519 | $13,720 | $46,799 |
| 2023 | $4,399 | $53,771 | $12,190 | $41,581 |
| 2022 | $4,126 | $48,640 | $11,027 | $37,613 |
| 2021 | $3,705 | $45,428 | $10,299 | $35,129 |
| 2020 | $3,487 | $43,142 | $9,781 | $33,361 |
| 2019 | $3,276 | $40,095 | $9,090 | $31,005 |
| 2018 | $2,989 | $35,995 | $8,166 | $27,829 |
| 2017 | $2,761 | $32,725 | $7,424 | $25,301 |
| 2016 | $2,582 | $30,022 | $6,826 | $23,196 |
| 2015 | $2,533 | $28,150 | $6,400 | $21,750 |
| 2014 | $2,533 | $28,000 | $6,350 | $21,650 |
| 2013 | $2,533 | $30,310 | $7,074 | $23,236 |
Source: Public Records
Map
Nearby Homes