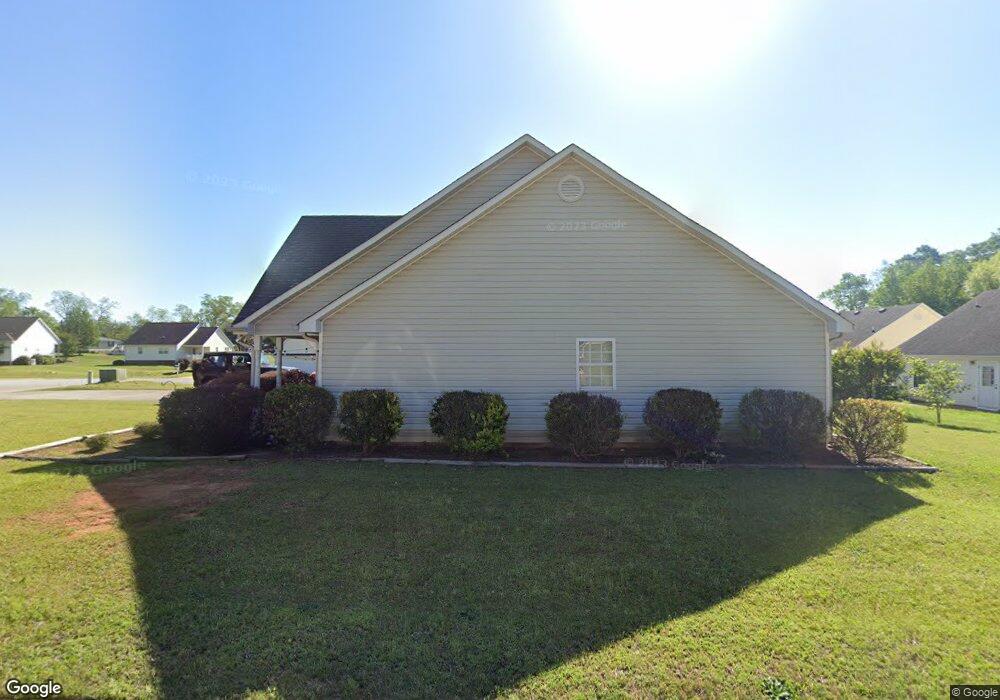
116 Summer Trace Unit 28 Thomaston, GA 30286
Estimated Value: $192,691 - $252,000
3
Beds
2
Baths
1,220
Sq Ft
$184/Sq Ft
Est. Value
About This Home
This home is located at 116 Summer Trace Unit 28, Thomaston, GA 30286 and is currently estimated at $224,423, approximately $183 per square foot. 116 Summer Trace Unit 28 is a home located in Upson County with nearby schools including Upson-Lee South Elementary School, Upson-Lee North Elementary School, and Upson-Lee Middle School.
Ownership History
Date
Name
Owned For
Owner Type
Purchase Details
Closed on
May 30, 2019
Sold by
Thomas Levon R
Bought by
Thomas Mark D
Current Estimated Value
Home Financials for this Owner
Home Financials are based on the most recent Mortgage that was taken out on this home.
Original Mortgage
$121,212
Outstanding Balance
$105,908
Interest Rate
4.1%
Mortgage Type
New Conventional
Estimated Equity
$118,515
Purchase Details
Closed on
Sep 5, 2014
Sold by
Hamilton State Bank
Bought by
Thomas Levon R
Home Financials for this Owner
Home Financials are based on the most recent Mortgage that was taken out on this home.
Original Mortgage
$80,000
Interest Rate
4.2%
Mortgage Type
New Conventional
Purchase Details
Closed on
Mar 20, 2014
Sold by
Silvertown Properties Llc
Bought by
Hamilton State Bank
Create a Home Valuation Report for This Property
The Home Valuation Report is an in-depth analysis detailing your home's value as well as a comparison with similar homes in the area
Purchase History
| Date | Buyer | Sale Price | Title Company |
|---|---|---|---|
| Thomas Mark D | $120,000 | -- | |
| Thomas Levon R | $76,000 | -- | |
| Hamilton State Bank | -- | -- |
Source: Public Records
Mortgage History
| Date | Status | Borrower | Loan Amount |
|---|---|---|---|
| Open | Thomas Mark D | $121,212 | |
| Previous Owner | Thomas Levon R | $80,000 |
Source: Public Records
Tax History
| Year | Tax Paid | Tax Assessment Tax Assessment Total Assessment is a certain percentage of the fair market value that is determined by local assessors to be the total taxable value of land and additions on the property. | Land | Improvement |
|---|---|---|---|---|
| 2025 | $1,901 | $65,114 | $5,200 | $59,914 |
| 2024 | $1,901 | $63,586 | $5,200 | $58,386 |
| 2023 | $1,911 | $61,474 | $5,200 | $56,274 |
| 2022 | $1,390 | $49,972 | $5,200 | $44,772 |
| 2021 | $1,333 | $46,766 | $8,000 | $38,766 |
| 2020 | $1,366 | $44,837 | $8,000 | $36,837 |
| 2019 | $1,064 | $33,514 | $4,000 | $29,514 |
| 2018 | $1,065 | $33,514 | $4,000 | $29,514 |
| 2017 | $1,277 | $36,540 | $6,000 | $30,540 |
| 2016 | $1,265 | $35,593 | $6,000 | $29,593 |
| 2015 | $1,072 | $35,593 | $6,000 | $29,593 |
| 2014 | $1,259 | $35,593 | $6,000 | $29,593 |
Source: Public Records
Map
Nearby Homes
- 600 4th Ave SW
- 900 Crystal Dr
- 129 R St SW
- 0 Lots On Cottage Ct Unit 1,2,5,7,8,9,10,11,13
- 0 Goodrich Ave N Unit 10690948
- 03 Multiple Rental Houses
- LOT 5 Hannahs Mill Rd
- 516 W Goodrich Ave
- 740 W Main St
- 119 S St NW
- 204 Doty Dr
- 609 Oak St
- 300 Poplar Dr
- 120 Mill Race Rd
- 146 O St NW
- 306 Doty Dr
- 407 Oak St
- 601 Nottingham St
- 0 9th Ave Unit 10500756
- 201 4th Ave SE
- 116 Summer Trace
- 118 Summer Trace Unit 29A
- 118 Summer Trace
- 114 Summer Trace
- 125 Summer Trace
- 112 Summer Trace Unit 26
- 112 Summer Trace
- 127 Summer Trace
- 120 Summer Trace Unit 30A
- 120 Summer Trace
- 123 Summer Trace
- 131 Summer Trace
- 110 Summer Trace Unit 25
- 110 Summer Trace
- 122 Summer Trace Unit 31A
- 122 Summer Trace
- 121 Summer Trace
- 129 Summer Trace
- 108 Summer Trace
- 133 Summer Trace
Your Personal Tour Guide
Ask me questions while you tour the home.