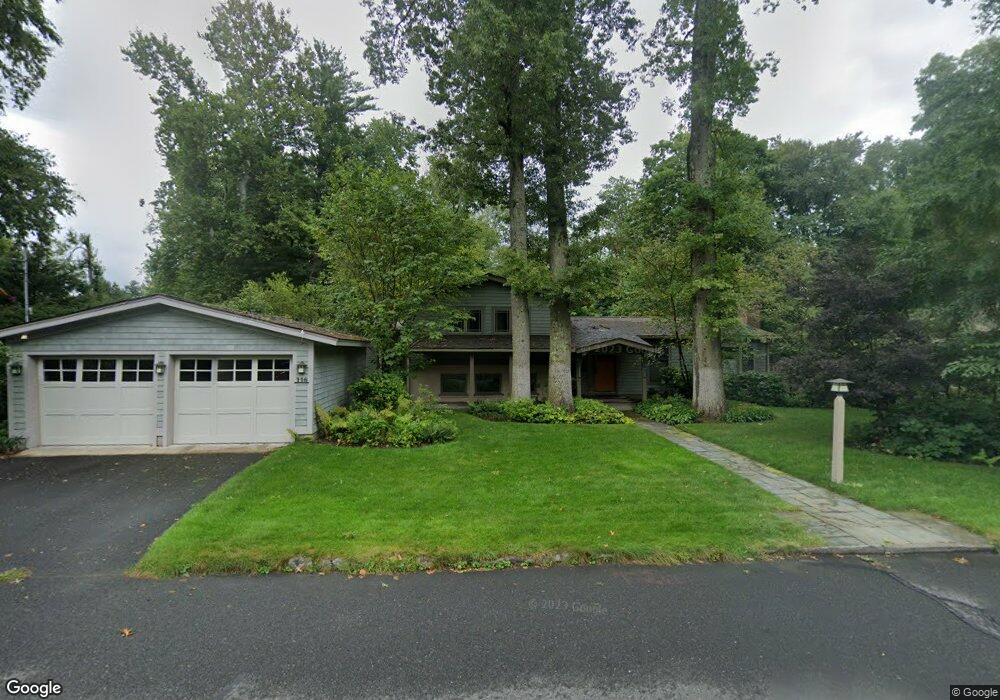
116 Vernon St Northampton, MA 01060
Estimated Value: $1,022,000 - $1,389,000
4
Beds
3
Baths
2,838
Sq Ft
$430/Sq Ft
Est. Value
About This Home
This home is located at 116 Vernon St, Northampton, MA 01060 and is currently estimated at $1,221,116, approximately $430 per square foot. 116 Vernon St is a home located in Hampshire County with nearby schools including Northampton High School, Hilltown Cooperative Charter Public School, and The Montessori School of Northampton.
Ownership History
Date
Name
Owned For
Owner Type
Purchase Details
Closed on
Aug 27, 2004
Sold by
Moore Grant and Moore Karen A
Bought by
Millman Loraine B
Current Estimated Value
Home Financials for this Owner
Home Financials are based on the most recent Mortgage that was taken out on this home.
Original Mortgage
$333,700
Outstanding Balance
$166,865
Interest Rate
6.02%
Mortgage Type
Purchase Money Mortgage
Estimated Equity
$1,054,251
Purchase Details
Closed on
Jun 30, 1992
Sold by
Kellogg Roger P and Kellogg Norma F
Bought by
Moore Grant and Moore Karen
Create a Home Valuation Report for This Property
The Home Valuation Report is an in-depth analysis detailing your home's value as well as a comparison with similar homes in the area
Home Values in the Area
Average Home Value in this Area
Purchase History
| Date | Buyer | Sale Price | Title Company |
|---|---|---|---|
| Millman Loraine B | $591,000 | -- | |
| Moore Grant | $260,000 | -- |
Source: Public Records
Mortgage History
| Date | Status | Borrower | Loan Amount |
|---|---|---|---|
| Open | Moore Grant | $333,700 | |
| Previous Owner | Moore Grant | $208,200 |
Source: Public Records
Tax History Compared to Growth
Tax History
| Year | Tax Paid | Tax Assessment Tax Assessment Total Assessment is a certain percentage of the fair market value that is determined by local assessors to be the total taxable value of land and additions on the property. | Land | Improvement |
|---|---|---|---|---|
| 2025 | $17,665 | $1,268,100 | $321,700 | $946,400 |
| 2024 | $17,736 | $1,167,600 | $321,700 | $845,900 |
| 2023 | $15,981 | $1,008,900 | $321,500 | $687,400 |
| 2022 | $16,037 | $896,400 | $300,600 | $595,800 |
| 2021 | $15,475 | $890,900 | $286,400 | $604,500 |
| 2020 | $14,428 | $858,800 | $286,400 | $572,400 |
| 2019 | $14,584 | $839,600 | $253,400 | $586,200 |
| 2018 | $13,715 | $804,900 | $253,400 | $551,500 |
| 2017 | $12,219 | $732,100 | $253,400 | $478,700 |
| 2016 | $11,831 | $732,100 | $253,400 | $478,700 |
| 2015 | $11,972 | $757,700 | $253,400 | $504,300 |
| 2014 | $11,661 | $757,700 | $253,400 | $504,300 |
Source: Public Records
Map
Nearby Homes
- 49 Kensington Ave
- 63 Riverside Dr
- 218 Elm St
- 11 Norwood Ave
- 61 Woodlawn Ave
- 14 Arlington St
- 321 Riverside Dr
- 325 Riverside Dr
- 5 Prospect Ct
- 37 Finn St
- 215 State St
- 35 New South St Unit 307
- 12 School St
- 0 Terrace Ln
- 43 Center St Unit K
- 244 Main St
- 74 Barrett St Unit 105
- 67 Old South St
- 51 1/2 Hatfield St Unit 6
- 36 Landy Ave