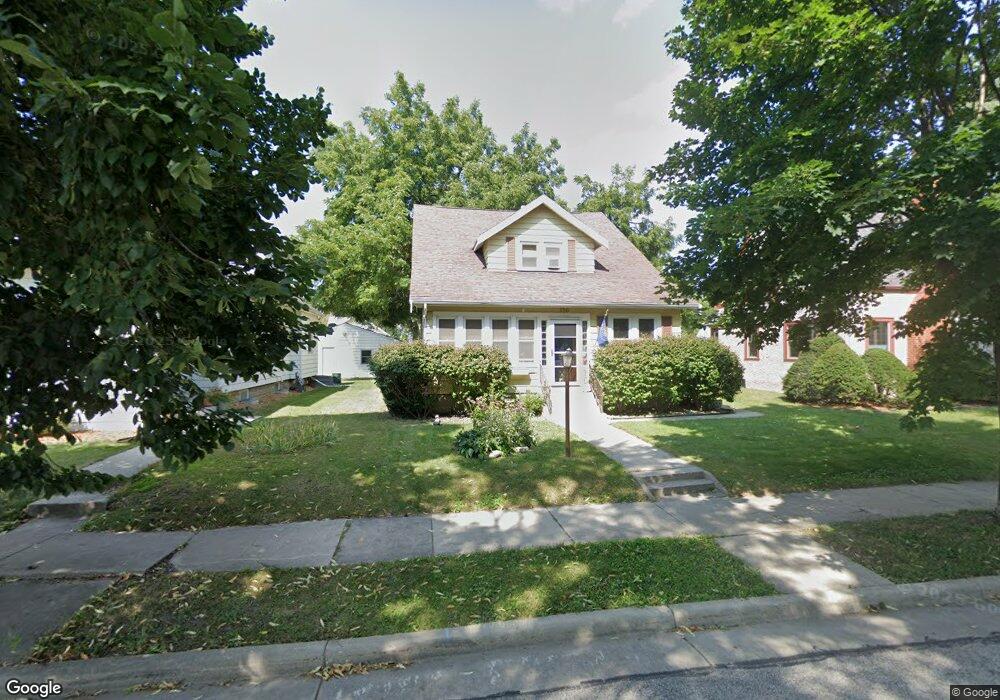
116 W Wabash Ave Waukesha, WI 53186
Estimated Value: $351,862 - $418,000
5
Beds
2
Baths
1,882
Sq Ft
$202/Sq Ft
Est. Value
About This Home
This home is located at 116 W Wabash Ave, Waukesha, WI 53186 and is currently estimated at $380,216, approximately $202 per square foot. 116 W Wabash Ave is a home located in Waukesha County with nearby schools including Waukesha STEM Academy, Horning Middle School, and South High School.
Ownership History
Date
Name
Owned For
Owner Type
Purchase Details
Closed on
Apr 27, 2023
Sold by
Marich Philip Scott
Bought by
Philip Marich Revocable Living Trust
Current Estimated Value
Purchase Details
Closed on
Dec 11, 2012
Sold by
Marich Philip Scott and Marich Majorie Gail
Bought by
Marich Philip Scott
Purchase Details
Closed on
Jul 28, 2005
Sold by
Debbins Josef P and Debbins Carmelle T
Bought by
Marich Philip S and Marich Marjorie G
Home Financials for this Owner
Home Financials are based on the most recent Mortgage that was taken out on this home.
Original Mortgage
$153,000
Interest Rate
5.71%
Mortgage Type
Fannie Mae Freddie Mac
Purchase Details
Closed on
Oct 6, 1997
Sold by
Schliecker Bernice
Bought by
Debbins Josef P and Debbins Carmelle T
Home Financials for this Owner
Home Financials are based on the most recent Mortgage that was taken out on this home.
Original Mortgage
$105,600
Interest Rate
7.26%
Create a Home Valuation Report for This Property
The Home Valuation Report is an in-depth analysis detailing your home's value as well as a comparison with similar homes in the area
Home Values in the Area
Average Home Value in this Area
Purchase History
| Date | Buyer | Sale Price | Title Company |
|---|---|---|---|
| Philip Marich Revocable Living Trust | -- | None Listed On Document | |
| Marich Philip Scott | -- | None Available | |
| Marich Philip S | $210,000 | -- | |
| Debbins Josef P | $132,500 | -- |
Source: Public Records
Mortgage History
| Date | Status | Borrower | Loan Amount |
|---|---|---|---|
| Previous Owner | Marich Philip S | $153,000 | |
| Previous Owner | Debbins Josef P | $105,600 |
Source: Public Records
Tax History Compared to Growth
Tax History
| Year | Tax Paid | Tax Assessment Tax Assessment Total Assessment is a certain percentage of the fair market value that is determined by local assessors to be the total taxable value of land and additions on the property. | Land | Improvement |
|---|---|---|---|---|
| 2024 | $4,284 | $290,500 | $48,400 | $242,100 |
| 2023 | $4,160 | $290,500 | $48,400 | $242,100 |
| 2022 | $3,427 | $181,600 | $47,600 | $134,000 |
| 2021 | $3,500 | $181,600 | $47,600 | $134,000 |
| 2020 | $3,394 | $181,600 | $47,600 | $134,000 |
| 2019 | $3,281 | $181,600 | $47,600 | $134,000 |
| 2018 | $3,134 | $169,700 | $45,400 | $124,300 |
| 2017 | $3,133 | $169,700 | $45,400 | $124,300 |
| 2016 | $3,179 | $161,600 | $45,400 | $116,200 |
| 2015 | $3,163 | $161,600 | $45,400 | $116,200 |
| 2014 | $3,231 | $158,400 | $45,400 | $113,000 |
| 2013 | $3,231 | $158,400 | $45,400 | $113,000 |
Source: Public Records
Map
Nearby Homes
- 312 W Wabash Ave
- 113 Coolidge Ave
- 401 S Grand Ave
- 340 Frame Ave
- 214 S West Ave
- 129 S West Ave
- 917 E Roberta Ave
- 1432 Big Bend Rd Unit E
- 1432 Tenny Ave Unit 201
- 1164 Downing Dr
- The Sequoia Plan at Aspen Overlook
- The Sycamore Plan at Aspen Overlook
- 1430 Tenny Ave Unit 201
- 1436 Tenny Ave Unit 101
- 1438 Tenny Ave Unit 101
- 125 Tenny Ave
- 1037 Windsor Dr
- 1522 Big Bend Rd Unit G
- LT1 Sunset View
- 1936 Cliff Alex Ct N
- 120 W Wabash Ave
- 112 W Wabash Ave
- 124 W Wabash Ave
- 128 W Wabash Ave
- 119 Frame Ave
- 113 Frame Ave
- 118 Frame Ave
- 114 Frame Ave
- 122 Frame Ave
- 127 Frame Ave
- 117 W Wabash Ave
- 132 W Wabash Ave
- 113 W Wabash Ave
- 121 W Wabash Ave
- 131 Frame Ave
- 130 Frame Ave
- 125 W Wabash Ave
- 136 W Wabash Ave
- 129 W Wabash Ave
- 135 Frame Ave