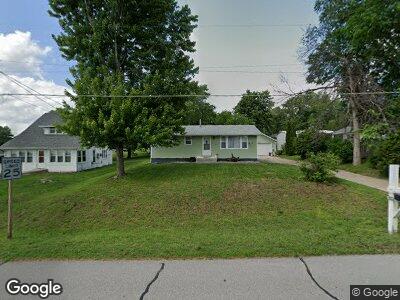
1160 NE 50th Ave Des Moines, IA 50313
Marquisville NeighborhoodEstimated Value: $159,000 - $172,000
2
Beds
1
Bath
864
Sq Ft
$192/Sq Ft
Est. Value
About This Home
This home is located at 1160 NE 50th Ave, Des Moines, IA 50313 and is currently estimated at $165,960, approximately $192 per square foot. 1160 NE 50th Ave is a home located in Polk County with nearby schools including Cornell Elementary School, Woodside Middle School, and Saydel High School.
Ownership History
Date
Name
Owned For
Owner Type
Purchase Details
Closed on
Nov 22, 2019
Sold by
Zoe Cornerstone Llc
Bought by
Gibson Rebekah
Current Estimated Value
Home Financials for this Owner
Home Financials are based on the most recent Mortgage that was taken out on this home.
Original Mortgage
$100,000
Outstanding Balance
$89,322
Interest Rate
3.5%
Mortgage Type
New Conventional
Estimated Equity
$73,310
Purchase Details
Closed on
May 3, 2019
Sold by
Tax Partnership 22 Llc
Bought by
Zoe Cornerstone Llc Series 1160
Purchase Details
Closed on
Sep 12, 2018
Sold by
County Of Polk
Bought by
Tax Partneship 22 Llc
Purchase Details
Closed on
Oct 13, 2010
Sold by
Clark David and Clark Paula
Bought by
Clark Paula
Home Financials for this Owner
Home Financials are based on the most recent Mortgage that was taken out on this home.
Original Mortgage
$17,000
Interest Rate
4.36%
Mortgage Type
Unknown
Create a Home Valuation Report for This Property
The Home Valuation Report is an in-depth analysis detailing your home's value as well as a comparison with similar homes in the area
Home Values in the Area
Average Home Value in this Area
Purchase History
| Date | Buyer | Sale Price | Title Company |
|---|---|---|---|
| Gibson Rebekah | $111,500 | None Available | |
| Zoe Cornerstone Llc Series 1160 | $65,000 | None Available | |
| Tax Partneship 22 Llc | -- | None Available | |
| Clark Paula | -- | None Available |
Source: Public Records
Mortgage History
| Date | Status | Borrower | Loan Amount |
|---|---|---|---|
| Open | Gibson Rebekah | $100,000 | |
| Previous Owner | Clark Paula | $17,000 |
Source: Public Records
Tax History Compared to Growth
Tax History
| Year | Tax Paid | Tax Assessment Tax Assessment Total Assessment is a certain percentage of the fair market value that is determined by local assessors to be the total taxable value of land and additions on the property. | Land | Improvement |
|---|---|---|---|---|
| 2024 | $1,790 | $141,100 | $36,100 | $105,000 |
| 2023 | $1,646 | $141,100 | $36,100 | $105,000 |
| 2022 | $1,630 | $109,900 | $29,000 | $80,900 |
| 2021 | $1,540 | $109,900 | $29,000 | $80,900 |
| 2020 | $1,652 | $98,700 | $25,900 | $72,800 |
| 2019 | $1,444 | $98,700 | $25,900 | $72,800 |
| 2018 | $1,561 | $91,600 | $23,600 | $68,000 |
| 2017 | $1,427 | $91,600 | $23,600 | $68,000 |
| 2016 | $1,364 | $88,000 | $22,100 | $65,900 |
| 2015 | $1,352 | $88,000 | $22,100 | $65,900 |
| 2014 | $1,403 | $87,900 | $21,700 | $66,200 |
Source: Public Records
Map
Nearby Homes
- 1300 NE 50th Place
- 5115 NE 13th St
- 1175 NE 52nd Ave
- 980 NE 54th Ave
- 500 NE 54th Ave
- 5470 NE 6th St
- 205 NW 51st Place
- 5515 & 5517 NE 1st St
- 225 NW 50th Place
- 4147 E 7th St
- 480 NE Aurora Ave
- 4131 Cornell St
- 1011 NE 60th Ave
- 45 NW Aurora Ave
- 5435 NW 4th Ct
- 4140 Cambridge St
- 831 Jerlynn Ave
- 4101 Columbia St
- 812 E Madison Ave
- 750 NE 60th Ave
- 1160 NE 50th Ave
- 1140 NE 50th Ave
- 5000 NE 12th St
- 1165 NE 50th Place
- 5004 NE 12th St
- 1143 NE 50th Ave
- 1153 NE 50th Ave
- 1104 NE 50th Ave
- 5005 NE 12th St
- 1240 NE 50th Ave
- 1041 NE 50th Ave
- 1245 NE 50th Place
- 1148 NE 50th Place
- 1257 NE 50th Ave
- 1160 NE 50th Place
- 5012 NE 12th St
- 5013 NE 12th St
- 1275 NE 50th Place
- 1240 NE 50th Place
- 1300 NE 50th Ave