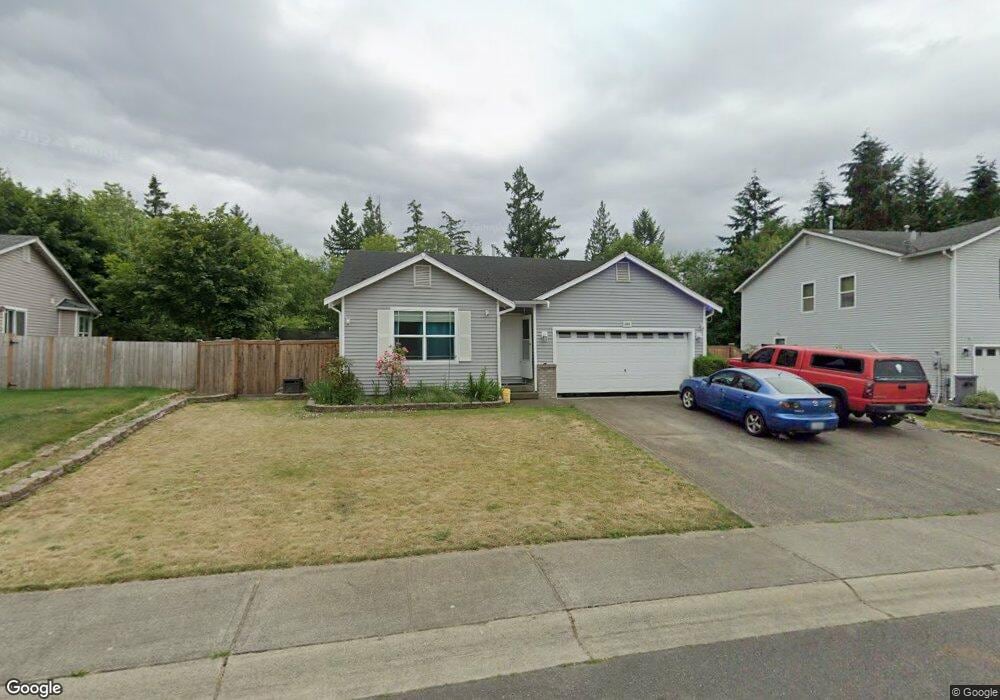
11602 209th St E Graham, WA 98338
Estimated Value: $452,000 - $494,000
3
Beds
2
Baths
1,280
Sq Ft
$366/Sq Ft
Est. Value
About This Home
This home is located at 11602 209th St E, Graham, WA 98338 and is currently estimated at $468,858, approximately $366 per square foot. 11602 209th St E is a home located in Pierce County with nearby schools including Nelson Elementary School, Frontier Middle School, and Graham Kapowsin High School.
Ownership History
Date
Name
Owned For
Owner Type
Purchase Details
Closed on
Feb 4, 2013
Sold by
Thompson Ean
Bought by
Thompson Ean and Thompson Yolanda
Current Estimated Value
Home Financials for this Owner
Home Financials are based on the most recent Mortgage that was taken out on this home.
Original Mortgage
$100,500
Outstanding Balance
$70,027
Interest Rate
3.34%
Mortgage Type
New Conventional
Estimated Equity
$398,831
Purchase Details
Closed on
Jun 5, 2003
Sold by
Lc Land Llc
Bought by
Thompson Ean
Home Financials for this Owner
Home Financials are based on the most recent Mortgage that was taken out on this home.
Original Mortgage
$124,400
Interest Rate
5.71%
Mortgage Type
Purchase Money Mortgage
Purchase Details
Closed on
Nov 6, 2002
Sold by
Maplewood Communities Inc
Bought by
Lc Land Llc
Home Financials for this Owner
Home Financials are based on the most recent Mortgage that was taken out on this home.
Original Mortgage
$7,025,600
Interest Rate
5.89%
Create a Home Valuation Report for This Property
The Home Valuation Report is an in-depth analysis detailing your home's value as well as a comparison with similar homes in the area
Home Values in the Area
Average Home Value in this Area
Purchase History
| Date | Buyer | Sale Price | Title Company |
|---|---|---|---|
| Thompson Ean | -- | First American Els | |
| Thompson Ean | $155,500 | Ticor Title Company | |
| Lc Land Llc | $3,744,000 | Chicago Title Insurance Co |
Source: Public Records
Mortgage History
| Date | Status | Borrower | Loan Amount |
|---|---|---|---|
| Open | Thompson Ean | $100,500 | |
| Closed | Thompson Ean | $124,400 | |
| Previous Owner | Lc Land Llc | $7,025,600 | |
| Closed | Thompson Ean | $15,500 |
Source: Public Records
Tax History
| Year | Tax Paid | Tax Assessment Tax Assessment Total Assessment is a certain percentage of the fair market value that is determined by local assessors to be the total taxable value of land and additions on the property. | Land | Improvement |
|---|---|---|---|---|
| 2025 | $4,593 | $415,200 | $185,300 | $229,900 |
| 2024 | $4,593 | $403,400 | $185,300 | $218,100 |
| 2023 | $4,593 | $392,900 | $192,500 | $200,400 |
| 2022 | $4,237 | $402,200 | $182,500 | $219,700 |
| 2021 | $3,867 | $273,800 | $118,600 | $155,200 |
| 2019 | $3,045 | $264,700 | $102,100 | $162,600 |
| 2018 | $3,310 | $240,300 | $85,600 | $154,700 |
| 2017 | $2,962 | $209,200 | $67,600 | $141,600 |
| 2016 | $2,599 | $160,200 | $45,800 | $114,400 |
| 2014 | $2,360 | $151,000 | $45,800 | $105,200 |
| 2013 | $2,360 | $137,700 | $43,200 | $94,500 |
Source: Public Records
Map
Nearby Homes
- 11220 212th St E
- 20216 110th Avenue Ct E
- 21504 107th Ave E
- 13724 199th St E
- 21117 129th Ave E
- 19411 112th Ave E
- 0 126th Ave E Unit NWM2354947
- 19123 110th Avenue Ct E
- 9905 201st Street Ct E
- 13216 215th Street Ct E
- 19114 110th Avenue Ct E
- 10812 188th St E Unit 1036
- 10812 188th St E
- 19011 112th Avenue Ct E
- 9822 201st St E
- 10774 188th St E
- 10774 188th St E Unit 1032
- 10770 188 St E Unit 1031
- 10770 188th St E
- 10766 188 St E Unit 1030
- 11524 209th St E
- 11610 209th St E
- 11520 209th St E
- 20811 115th Ave E
- 11614 209th St E
- 11516 209th St E
- 11603 209th St E
- 20807 115th Avct E
- 20807 115th Ave E
- 11607 209th St E
- 11512 209th St E
- 11706 209th St E
- 20810 115th Ave E
- 20810 115th Ave E
- 20803 115th Ave E
- 20803 115th Avenue Ct E
- 20803 115th Ave E
- 20803 115th Ave E
- 11615 209th St E
- 11508 209th St E
Your Personal Tour Guide
Ask me questions while you tour the home.