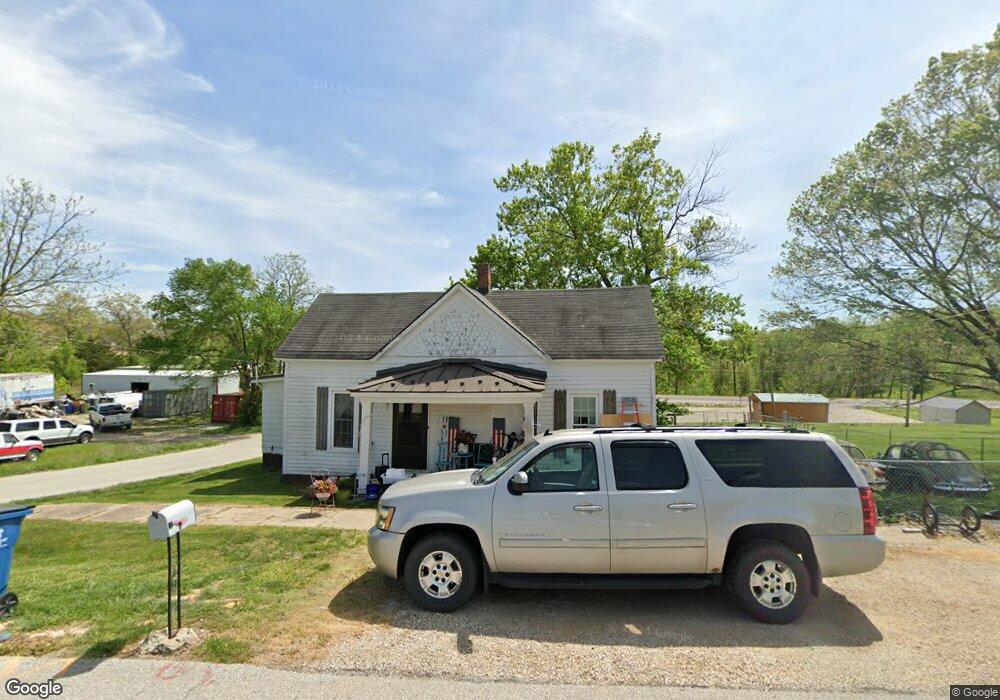
11603 Main St Centertown, MO 65023
Estimated Value: $98,735 - $204,000
2
Beds
1
Bath
964
Sq Ft
$150/Sq Ft
Est. Value
About This Home
This home is located at 11603 Main St, Centertown, MO 65023 and is currently estimated at $144,245, approximately $149 per square foot. 11603 Main St is a home located in Cole County with nearby schools including Pioneer Trail Elementary School, Thomas Jefferson Middle School, and Capital City High School.
Ownership History
Date
Name
Owned For
Owner Type
Purchase Details
Closed on
Aug 31, 2023
Sold by
Byrnes James L and Byrnes Dawn M
Bought by
Hill View Enterprises Llc
Current Estimated Value
Purchase Details
Closed on
Apr 20, 2022
Sold by
Tc Property Investments Llc
Bought by
Cali Mo Homes Llc
Purchase Details
Closed on
Apr 15, 2022
Sold by
Crocker and Emalea
Bought by
Tc Property Investments Llc
Purchase Details
Closed on
Aug 18, 2021
Sold by
Rademan Rachel M and Terpstra Elizabeth F
Bought by
Crocker Tyler and Crocker Emalea
Create a Home Valuation Report for This Property
The Home Valuation Report is an in-depth analysis detailing your home's value as well as a comparison with similar homes in the area
Home Values in the Area
Average Home Value in this Area
Purchase History
| Date | Buyer | Sale Price | Title Company |
|---|---|---|---|
| Hill View Enterprises Llc | -- | None Listed On Document | |
| Cali Mo Homes Llc | -- | None Listed On Document | |
| Tc Property Investments Llc | -- | None Listed On Document | |
| Crocker Tyler | -- | None Available |
Source: Public Records
Tax History Compared to Growth
Tax History
| Year | Tax Paid | Tax Assessment Tax Assessment Total Assessment is a certain percentage of the fair market value that is determined by local assessors to be the total taxable value of land and additions on the property. | Land | Improvement |
|---|---|---|---|---|
| 2025 | $453 | $7,050 | $1,140 | $5,910 |
| 2024 | $453 | $7,050 | $1,140 | $5,910 |
| 2023 | $453 | $7,050 | $1,140 | $5,910 |
| 2022 | $429 | $6,650 | $0 | $6,650 |
| 2021 | $433 | $6,650 | $0 | $6,650 |
| 2020 | $437 | $9,291 | $1,140 | $8,151 |
| 2019 | $426 | $7,543 | $1,140 | $6,403 |
| 2018 | $426 | $7,296 | $1,140 | $6,156 |
| 2017 | $416 | $6,650 | $1,140 | $5,510 |
| 2016 | -- | $6,650 | $1,140 | $5,510 |
| 2015 | $360 | $0 | $0 | $0 |
| 2014 | $360 | $6,650 | $1,140 | $5,510 |
Source: Public Records
Map
Nearby Homes
- 223 Route U
- 112 Dixie Gardens
- 12614 Lookout Trail
- 318 Murphy Ford Road (Land Only) Rd
- 52968 W Railroad Rd
- 0 Murphy Ford Rd
- 10412 N Ridge Rd
- 0 Route Nn
- 0
- 30461 Oak Meadows Rd
- 215 Carel Rd
- 202 Carel Rd
- 0 Poelker Place Unit 10070469
- 0 Poelker Place Unit 10070470
- 32730 Henley Lake Dr
- 11328 Hunziker Rd
- 3705 Widgeonwood Way
- 313 Ridge Top Dr
- 301 Ridge Top Dr
- 10709 W Lohman Rd
- 11609 Main St
- 11602 Lookout Trail
- 1205 Madison St
- 11703 Main St
- 11618 E Railroad Rd
- 11610 E Railroad Rd
- 11707 Main St
- 11608 E Railroad Rd
- 11706 E Railroad Rd
- 11515 Main St
- 11710 E Railroad Rd
- 11623 Lookout Trail
- 11712 E Railroad Rd
- 103 S Monroe St
- 11518 E Railroad Rd
- 11714 E Mill St
- 11720 E Railroad Rd
- 111 S Monroe St
- 11714 E
- 11805 Main St