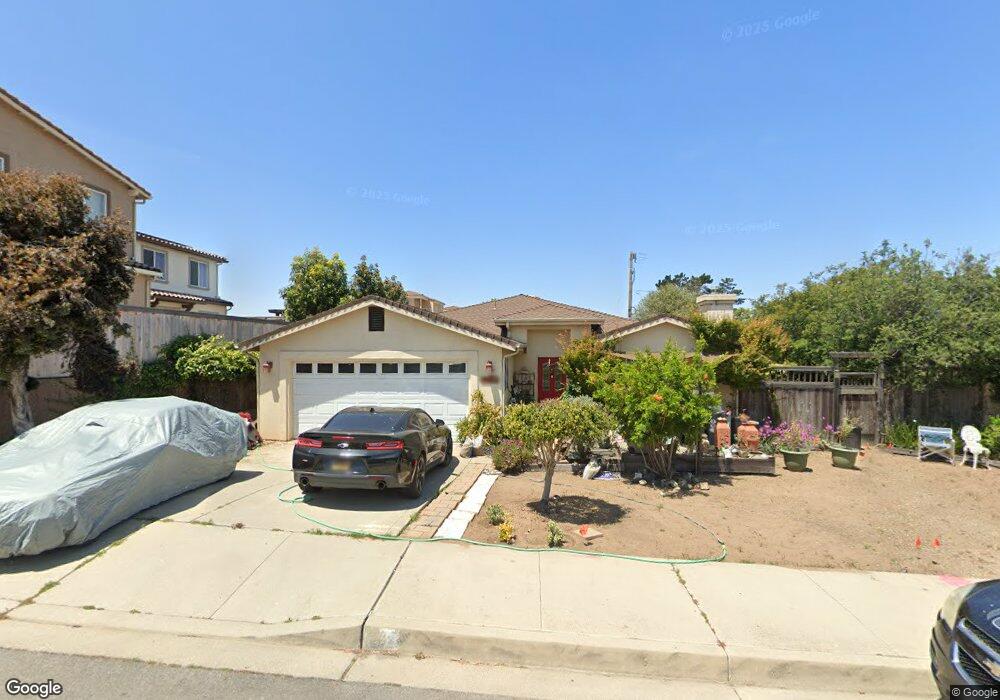
1162 Bodega Ct Grover Beach, CA 93433
Estimated Value: $432,000 - $1,557,000
3
Beds
2
Baths
1,609
Sq Ft
$572/Sq Ft
Est. Value
About This Home
This home is located at 1162 Bodega Ct, Grover Beach, CA 93433 and is currently estimated at $920,529, approximately $572 per square foot. 1162 Bodega Ct is a home located in San Luis Obispo County with nearby schools including Grover Beach Elementary School, Paulding Middle School, and Arroyo Grande High School.
Ownership History
Date
Name
Owned For
Owner Type
Purchase Details
Closed on
Jun 15, 2022
Sold by
Florez Janet D
Bought by
Janet Florez Revocable Living Trust
Current Estimated Value
Purchase Details
Closed on
Feb 26, 2018
Sold by
Florez Janet D
Bought by
Florez Janet D
Home Financials for this Owner
Home Financials are based on the most recent Mortgage that was taken out on this home.
Original Mortgage
$423,753
Interest Rate
4.04%
Mortgage Type
New Conventional
Purchase Details
Closed on
Mar 3, 2000
Sold by
Gutierrez Rudy S
Bought by
Florez Janet D
Home Financials for this Owner
Home Financials are based on the most recent Mortgage that was taken out on this home.
Original Mortgage
$223,250
Interest Rate
8.38%
Create a Home Valuation Report for This Property
The Home Valuation Report is an in-depth analysis detailing your home's value as well as a comparison with similar homes in the area
Home Values in the Area
Average Home Value in this Area
Purchase History
| Date | Buyer | Sale Price | Title Company |
|---|---|---|---|
| Janet Florez Revocable Living Trust | -- | None Listed On Document | |
| Florez Janet D | -- | Placer Title Co | |
| Florez Janet D | -- | Fidelity National Title Co | |
| Florez Janet D | $235,000 | Fidelity National Title Co |
Source: Public Records
Mortgage History
| Date | Status | Borrower | Loan Amount |
|---|---|---|---|
| Previous Owner | Florez Janet D | $423,753 | |
| Previous Owner | Florez Janet D | $223,250 |
Source: Public Records
Tax History
| Year | Tax Paid | Tax Assessment Tax Assessment Total Assessment is a certain percentage of the fair market value that is determined by local assessors to be the total taxable value of land and additions on the property. | Land | Improvement |
|---|---|---|---|---|
| 2025 | $3,975 | $361,166 | $169,056 | $192,110 |
| 2024 | $3,942 | $354,086 | $165,742 | $188,344 |
| 2023 | $3,942 | $347,144 | $162,493 | $184,651 |
| 2022 | $3,879 | $340,338 | $159,307 | $181,031 |
| 2021 | $3,832 | $333,666 | $156,184 | $177,482 |
| 2020 | $3,788 | $330,246 | $154,583 | $175,663 |
| 2019 | $3,755 | $323,771 | $151,552 | $172,219 |
| 2018 | $3,707 | $317,424 | $148,581 | $168,843 |
| 2017 | $3,540 | $311,201 | $145,668 | $165,533 |
| 2016 | $3,298 | $305,100 | $142,812 | $162,288 |
| 2015 | $3,222 | $300,518 | $140,667 | $159,851 |
| 2014 | $3,034 | $294,632 | $137,912 | $156,720 |
Source: Public Records
Map
Nearby Homes
- 1410 Farroll Rd
- 1362 Farroll Rd
- 1261 San Sorrento Ct
- 943 Huston St
- 110 Anita Ave
- 948 Huston St
- 1060 Baden Ave Unit 9
- 1277 Belridge St Unit 6A
- 1277 Belridge St Unit 1A
- 1092 Baden Ave
- 161 Janet Ave
- 181 Janet Ave
- 1103 Rose Ct
- 978 Griffin St
- 1093 Belridge St
- 1935 Capistrano Ct
- 1965 Solana Ct
- 1212 Pacific Blvd
- 1234 Seabright Ave
- 1515 Ocean St
- 1152 Bodega Ct
- 1305 Crystal Cove Cir
- 1301 Crystal Cove Cir
- 1311 Crystal Cove Cir
- 1142 Bodega Ct
- 1167 Bodega Ct
- 1207 S 13th St
- 1207 S 13th St Unit Lot 10
- 1207 S 13th St Unit Lot 7
- 1207 S 13th St Unit Lot 2
- 1207 S 13th St Unit Lot 13
- 1297 Aberdeen Ct Unit 4
- 1297 Aberdeen Ct
- 1157 Bodega Ct
- 1317 Crystal Cove Cir
- 1286 Aberdeen Ct Unit 8
- 1286 Aberdeen Ct
- 1202 Sand Dollar Dr
- 1205 Sand Dollar Dr
- 1147 Bodega Ct
Your Personal Tour Guide
Ask me questions while you tour the home.