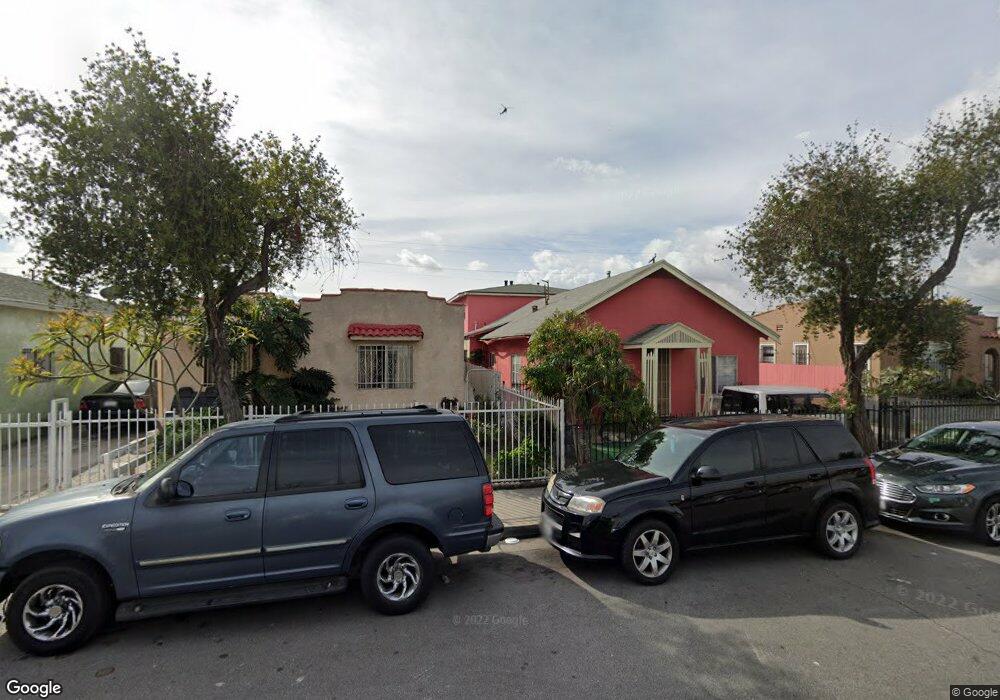
1162 E 76th St Los Angeles, CA 90001
Florence-Graham NeighborhoodEstimated Value: $711,000 - $835,000
7
Beds
3
Baths
2,294
Sq Ft
$335/Sq Ft
Est. Value
About This Home
This home is located at 1162 E 76th St, Los Angeles, CA 90001 and is currently estimated at $769,000, approximately $335 per square foot. 1162 E 76th St is a home located in Los Angeles County with nearby schools including Parmelee Avenue Elementary School, Thomas A. Edison Middle School, and Academy For Multiligual Arts And Science At Mervyn M. Dymally High.
Ownership History
Date
Name
Owned For
Owner Type
Purchase Details
Closed on
Sep 4, 2015
Sold by
Duette Michael A and Thierry Linda Q
Bought by
Thierry Linda Q
Current Estimated Value
Home Financials for this Owner
Home Financials are based on the most recent Mortgage that was taken out on this home.
Original Mortgage
$225,000
Outstanding Balance
$176,723
Interest Rate
3.91%
Mortgage Type
New Conventional
Estimated Equity
$592,277
Purchase Details
Closed on
Sep 2, 2015
Sold by
Thierry Lloyd C
Bought by
Thierry Linda Q
Home Financials for this Owner
Home Financials are based on the most recent Mortgage that was taken out on this home.
Original Mortgage
$225,000
Outstanding Balance
$176,723
Interest Rate
3.91%
Mortgage Type
New Conventional
Estimated Equity
$592,277
Purchase Details
Closed on
Sep 19, 2014
Sold by
Duette Michael A and Duette Willie
Bought by
Duette Michael A and Thierry Linda Q
Purchase Details
Closed on
Jan 6, 2010
Sold by
Duette Willie and Duette Ada
Bought by
Duette Willie and Duette Ada M
Create a Home Valuation Report for This Property
The Home Valuation Report is an in-depth analysis detailing your home's value as well as a comparison with similar homes in the area
Home Values in the Area
Average Home Value in this Area
Purchase History
| Date | Buyer | Sale Price | Title Company |
|---|---|---|---|
| Thierry Linda Q | -- | Provident Title | |
| Thierry Linda Q | -- | Provident Title | |
| Duette Michael A | -- | None Available | |
| Duette Willie | -- | None Available |
Source: Public Records
Mortgage History
| Date | Status | Borrower | Loan Amount |
|---|---|---|---|
| Open | Thierry Linda Q | $225,000 |
Source: Public Records
Tax History Compared to Growth
Tax History
| Year | Tax Paid | Tax Assessment Tax Assessment Total Assessment is a certain percentage of the fair market value that is determined by local assessors to be the total taxable value of land and additions on the property. | Land | Improvement |
|---|---|---|---|---|
| 2025 | $5,088 | $281,738 | $164,036 | $117,702 |
| 2024 | $5,088 | $276,215 | $160,820 | $115,395 |
| 2023 | $4,762 | $270,800 | $157,667 | $113,133 |
| 2022 | $4,582 | $265,491 | $154,576 | $110,915 |
| 2021 | $4,525 | $260,287 | $151,546 | $108,741 |
| 2020 | $4,548 | $258,299 | $149,993 | $108,306 |
| 2019 | $4,408 | $253,248 | $147,052 | $106,196 |
| 2018 | $4,293 | $248,297 | $144,169 | $104,128 |
| 2017 | $4,218 | $242,763 | $141,343 | $101,420 |
| 2016 | $4,112 | $238,004 | $138,572 | $99,432 |
| 2015 | $1,893 | $49,310 | $11,598 | $37,712 |
| 2014 | $1,905 | $48,345 | $11,371 | $36,974 |
Source: Public Records
Map
Nearby Homes
- 1124 E 76th Place
- 1207 E 76th St
- 1235 E 75th St
- 1259 E 78th St
- 1222 E 78th St
- 1147 Nadeau St
- 1008 E 74th St
- 1244 Nadeau St
- 7411 Elsie St
- 1413 E 77th St
- 1150 E 80th St
- 7408 Elsie St
- 7317 Parmelee Ave
- 7754 S Central Ave
- 822 E 77th St
- 804 E 76th Place
- 7700 Mckinley Ave
- 815 E 80th St
- 7114 7116 Miramonte Blvd
- 1449 1451 E 75th St
- 1162 E 76th Place
- 1200 E 76th Place
- 1156 E 76th Place
- 1204 E 76th Place
- 1152 E 76th Place
- 1208 E 76th Place
- 1148 E 76th Place
- 1161 E 77th St
- 1157 E 77th St
- 1144 E 76th Place
- 1212 E 76th Place Unit 4
- 1212 E 76th Place Unit 3
- 1205 E 77th St
- 1161 E 76th Place
- 1203 E 76th Place
- 1157 E 76th Place
- 1207 E 76th Place
- 1209 E 77th St
- 1216 E 76th Place Unit 1
- 1142 E 76th Place