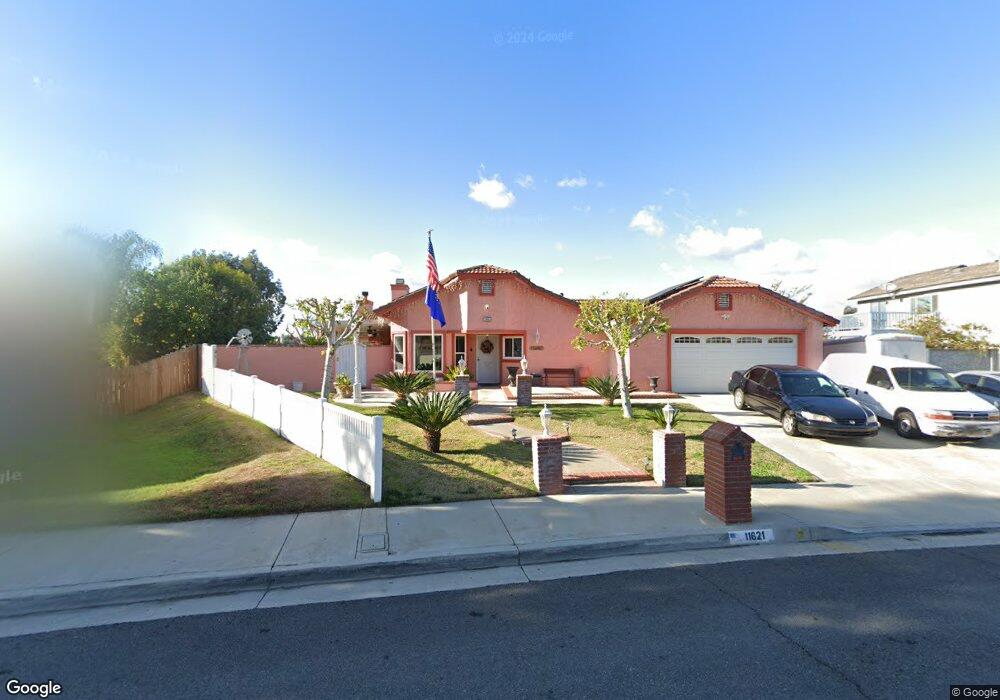
11621 Freedom Trail Riverside, CA 92503
La Sierra South NeighborhoodEstimated Value: $648,176 - $661,000
4
Beds
2
Baths
1,557
Sq Ft
$422/Sq Ft
Est. Value
About This Home
This home is located at 11621 Freedom Trail, Riverside, CA 92503 and is currently estimated at $657,044, approximately $421 per square foot. 11621 Freedom Trail is a home located in Riverside County with nearby schools including Alan Orrenmaa Elementary School, Arizona Middle School, and Hillcrest High School.
Ownership History
Date
Name
Owned For
Owner Type
Purchase Details
Closed on
Mar 9, 2006
Sold by
Clark Beverly Ann
Bought by
Clark James E and Clark Beverly Ann
Current Estimated Value
Home Financials for this Owner
Home Financials are based on the most recent Mortgage that was taken out on this home.
Original Mortgage
$247,000
Outstanding Balance
$139,759
Interest Rate
6.19%
Mortgage Type
New Conventional
Estimated Equity
$517,285
Purchase Details
Closed on
Nov 7, 2002
Sold by
Clark James Edward
Bought by
Clark Beverly Ann
Home Financials for this Owner
Home Financials are based on the most recent Mortgage that was taken out on this home.
Original Mortgage
$150,000
Interest Rate
5.89%
Mortgage Type
Stand Alone First
Purchase Details
Closed on
Jul 28, 2000
Sold by
Young Beverly Ann and Young Beverly Ann
Bought by
Clark James Edward and Clark Beverly Ann
Purchase Details
Closed on
Jun 23, 1995
Sold by
Whisler David G and Whisler Eva Ilene
Bought by
Young Beverly Ann
Home Financials for this Owner
Home Financials are based on the most recent Mortgage that was taken out on this home.
Original Mortgage
$113,184
Interest Rate
7.61%
Mortgage Type
FHA
Create a Home Valuation Report for This Property
The Home Valuation Report is an in-depth analysis detailing your home's value as well as a comparison with similar homes in the area
Home Values in the Area
Average Home Value in this Area
Purchase History
| Date | Buyer | Sale Price | Title Company |
|---|---|---|---|
| Clark James E | -- | Chicago Title | |
| Clark Beverly Ann | -- | Fidelity National Title Co | |
| Clark James Edward | -- | -- | |
| Young Beverly Ann | $114,000 | First American Title Ins Co |
Source: Public Records
Mortgage History
| Date | Status | Borrower | Loan Amount |
|---|---|---|---|
| Open | Clark James E | $247,000 | |
| Closed | Clark Beverly Ann | $150,000 | |
| Closed | Young Beverly Ann | $113,184 |
Source: Public Records
Tax History
| Year | Tax Paid | Tax Assessment Tax Assessment Total Assessment is a certain percentage of the fair market value that is determined by local assessors to be the total taxable value of land and additions on the property. | Land | Improvement |
|---|---|---|---|---|
| 2025 | $2,744 | $232,885 | $83,042 | $149,843 |
| 2023 | $2,744 | $223,843 | $79,818 | $144,025 |
| 2022 | $2,538 | $219,454 | $78,253 | $141,201 |
| 2021 | $2,504 | $215,152 | $76,719 | $138,433 |
| 2020 | $2,464 | $212,947 | $75,933 | $137,014 |
| 2019 | $2,431 | $208,773 | $74,445 | $134,328 |
| 2018 | $2,396 | $204,681 | $72,987 | $131,694 |
| 2017 | $2,350 | $200,668 | $71,556 | $129,112 |
| 2016 | $2,311 | $196,734 | $70,153 | $126,581 |
| 2015 | $2,276 | $193,781 | $69,100 | $124,681 |
| 2014 | $2,266 | $189,988 | $67,748 | $122,240 |
Source: Public Records
Map
Nearby Homes
- 11638 Freedom Trail
- 11619 Capitol Dr
- 3415 Revere Rd
- 3701 Fillmore St Unit 64
- 3701 Fillmore St
- 3701 Fillmore St Unit 32
- 3701 Fillmore St Unit 36
- 3445 Sparrow Cir
- 0 Rancho Corto Dr
- 3666 Ada Ct
- 3129 Wickham Dr
- 12149 Indiana Ave Unit 18
- 12149 Indiana Ave Unit 95
- 11552 Brookrun Ct
- 3663 Buchanan St Unit 112
- 3663 Buchanan St Unit 130
- 3533 Millhouse Ct
- 16123 Setting Sun Cir
- 11571 Trailrun Ct
- 3883 Buchanan St Unit 3
- 11611 Freedom Trail
- 3555 Philadelphia Ct
- 11645 Capitol Dr
- 3565 Philadelphia Ct
- 11651 Capitol Dr
- 3545 Philadelphia Ct
- 11591 Freedom Trail
- 3575 Philadelphia Ct
- 11655 Capitol Dr
- 11628 Freedom Trail
- 11583 Freedom Trail
- 11586 Freedom Trail
- 3558 Philadelphia Ct
- 11661 Capitol Dr
- 3553 Gettysburg Dr
- 3581 Philadelphia Ct
- 11640 Capitol Dr
- 11646 Capitol Dr
- 11636 Capit0l
- 11636 Capitol Dr
Your Personal Tour Guide
Ask me questions while you tour the home.