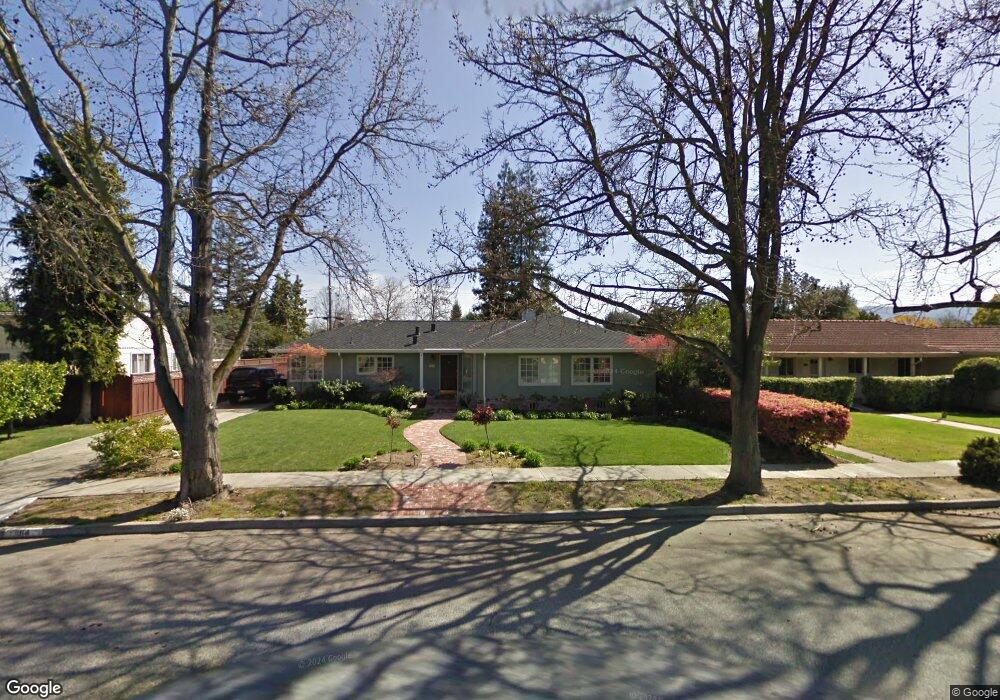
1164 Husted Ave San Jose, CA 95125
Willow Glen South-Lincoln Glen NeighborhoodEstimated Value: $2,187,000 - $2,491,000
3
Beds
3
Baths
1,673
Sq Ft
$1,428/Sq Ft
Est. Value
About This Home
This home is located at 1164 Husted Ave, San Jose, CA 95125 and is currently estimated at $2,388,260, approximately $1,427 per square foot. 1164 Husted Ave is a home located in Santa Clara County with nearby schools including Schallenberger Elementary School, Willow Glen Middle, and Willow Glen High School.
Ownership History
Date
Name
Owned For
Owner Type
Purchase Details
Closed on
Nov 15, 2004
Sold by
Eberhardt Shawn P and Eberhardt Susana
Bought by
Clark Jason T and Clark Angela R
Current Estimated Value
Home Financials for this Owner
Home Financials are based on the most recent Mortgage that was taken out on this home.
Original Mortgage
$620,000
Outstanding Balance
$298,419
Interest Rate
5.25%
Mortgage Type
Purchase Money Mortgage
Estimated Equity
$2,089,841
Purchase Details
Closed on
Apr 19, 1996
Sold by
Mcmorrow Gregory T and Affonso Jacquelyn J
Bought by
Eberhardt Shawn P and Eberhardt Susana
Home Financials for this Owner
Home Financials are based on the most recent Mortgage that was taken out on this home.
Original Mortgage
$278,400
Interest Rate
7.5%
Create a Home Valuation Report for This Property
The Home Valuation Report is an in-depth analysis detailing your home's value as well as a comparison with similar homes in the area
Home Values in the Area
Average Home Value in this Area
Purchase History
| Date | Buyer | Sale Price | Title Company |
|---|---|---|---|
| Clark Jason T | $790,000 | Old Republic Title Company | |
| Eberhardt Shawn P | $348,000 | Chicago Title Co |
Source: Public Records
Mortgage History
| Date | Status | Borrower | Loan Amount |
|---|---|---|---|
| Open | Clark Jason T | $620,000 | |
| Previous Owner | Eberhardt Shawn P | $278,400 |
Source: Public Records
Tax History Compared to Growth
Tax History
| Year | Tax Paid | Tax Assessment Tax Assessment Total Assessment is a certain percentage of the fair market value that is determined by local assessors to be the total taxable value of land and additions on the property. | Land | Improvement |
|---|---|---|---|---|
| 2025 | $15,408 | $1,228,037 | $770,826 | $457,211 |
| 2024 | $15,408 | $1,203,959 | $755,712 | $448,247 |
| 2023 | $15,124 | $1,180,353 | $740,895 | $439,458 |
| 2022 | $14,981 | $1,157,210 | $726,368 | $430,842 |
| 2021 | $14,686 | $1,134,521 | $712,126 | $422,395 |
| 2020 | $13,788 | $1,073,009 | $704,825 | $368,184 |
| 2019 | $12,835 | $995,127 | $691,005 | $304,122 |
| 2018 | $12,616 | $967,792 | $677,456 | $290,336 |
| 2017 | $12,517 | $948,817 | $664,173 | $284,644 |
| 2016 | $12,318 | $930,213 | $651,150 | $279,063 |
| 2015 | $12,240 | $916,242 | $641,370 | $274,872 |
| 2014 | $11,714 | $898,295 | $628,807 | $269,488 |
Source: Public Records
Map
Nearby Homes
- 1027 Shenandoah Dr
- 2265 Mazzaglia Ave
- 1028 Pascoe Ave
- 1247 Curtner Ave
- 921 Kingfisher Dr
- 1109 Lincoln Ct
- 1105 Lincoln Ct
- 940 Sunbonnet Loop
- 1202 Foxworthy Ave
- 2119 Harmil Way
- 2871 Rubino Cir
- 817 Pitkin Loop
- 2829 Rubino Cir
- 2059 Jonathan Ave
- 2296 Almaden Rd Unit B
- 3066 Nattinger Ln
- 2206 Almaden Rd Unit B
- 1267 Hillsdale Ave
- 3048 Brunetti Way Unit 47
- 1037 Hazelwood Ave
- 1172 Husted Ave
- 1167 Janis Way
- 1163 Janis Way
- 1180 Husted Ave
- 1171 Janis Way
- 1153 Janis Way
- 1161 Husted Ave
- 1169 Husted Ave
- 1153 Husted Ave
- 1188 Husted Ave
- 1177 Husted Ave
- 1140 Husted Ave
- 1187 Janis Way
- 1145 Janis Way
- 1145 Husted Ave
- 1185 Husted Ave
- 1132 Husted Ave
- 1168 Janis Way
- 1196 Husted Ave
- 1176 Janis Way