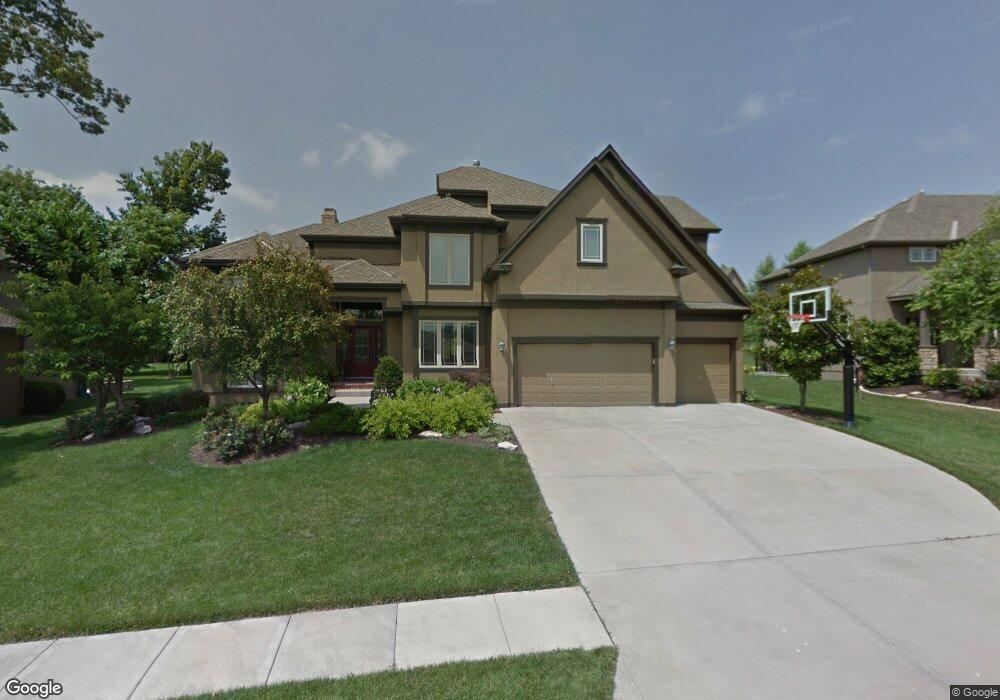
11640 S Gleason Rd Olathe, KS 66061
Estimated Value: $632,797 - $747,000
4
Beds
4
Baths
3,272
Sq Ft
$211/Sq Ft
Est. Value
About This Home
This home is located at 11640 S Gleason Rd, Olathe, KS 66061 and is currently estimated at $691,199, approximately $211 per square foot. 11640 S Gleason Rd is a home located in Johnson County with nearby schools including Cedar Creek Elementary School, Mission Trail Middle School, and Olathe West High School.
Ownership History
Date
Name
Owned For
Owner Type
Purchase Details
Closed on
Oct 1, 2011
Sold by
Landry David W and Mcgrath Landry Leslie J
Bought by
Steinlage Dana P and Steinlage Crystal M
Current Estimated Value
Purchase Details
Closed on
Jun 1, 2006
Sold by
K C Building Company Llc
Bought by
Landry David W and Mccrath Landry Leslie J
Home Financials for this Owner
Home Financials are based on the most recent Mortgage that was taken out on this home.
Original Mortgage
$69,892
Interest Rate
6.56%
Mortgage Type
Credit Line Revolving
Purchase Details
Closed on
Jun 17, 2005
Sold by
Cedar Creek Properties Inc
Bought by
K C Building Company Inc
Create a Home Valuation Report for This Property
The Home Valuation Report is an in-depth analysis detailing your home's value as well as a comparison with similar homes in the area
Home Values in the Area
Average Home Value in this Area
Purchase History
| Date | Buyer | Sale Price | Title Company |
|---|---|---|---|
| Steinlage Dana P | -- | Continental Title Company | |
| Landry David W | -- | First American Title Ins Co | |
| K C Building Company Inc | -- | First American Title Slt |
Source: Public Records
Mortgage History
| Date | Status | Borrower | Loan Amount |
|---|---|---|---|
| Previous Owner | Landry David W | $69,892 | |
| Previous Owner | Landry David W | $372,760 |
Source: Public Records
Tax History Compared to Growth
Tax History
| Year | Tax Paid | Tax Assessment Tax Assessment Total Assessment is a certain percentage of the fair market value that is determined by local assessors to be the total taxable value of land and additions on the property. | Land | Improvement |
|---|---|---|---|---|
| 2024 | $7,336 | $64,481 | $13,329 | $51,152 |
| 2023 | $6,862 | $59,467 | $12,110 | $47,357 |
| 2022 | $6,136 | $51,762 | $11,008 | $40,754 |
| 2021 | $6,225 | $50,163 | $10,008 | $40,155 |
| 2020 | $6,608 | $52,739 | $10,008 | $42,731 |
| 2019 | $6,270 | $49,726 | $9,006 | $40,720 |
| 2018 | $5,862 | $46,172 | $8,189 | $37,983 |
| 2017 | $5,719 | $44,585 | $8,189 | $36,396 |
| 2016 | $5,436 | $43,458 | $8,189 | $35,269 |
| 2015 | $5,336 | $42,676 | $8,189 | $34,487 |
| 2013 | -- | $42,320 | $8,599 | $33,721 |
Source: Public Records
Map
Nearby Homes
- 11263 S Gleason Rd
- 11275 S Gleason Rd
- 11287 S Gleason Rd
- 11248 S Gleason Rd
- 11717 S Barth Rd
- 11580 S Carbondale St
- 24135 W 113th Terrace
- 11758 S Mesquite St
- 23690 W 118th St
- 23717 W 118th Terrace
- 11775 S Kenton St
- 23733 W 118th Terrace
- 11807 S Kenton St
- 23330 W 119th St
- 11320 S Cook St
- 11506 S Houston St
- 24268 W 111th Place
- 11209 S Sunray Dr
- 11221 S Sunray Dr
- 11233 S Sunray Dr
- 11640 Gleason Rd
- 11650 Gleason Rd
- 11630 S Gleason Rd
- 11630 Gleason Rd
- 11673 S Lewis Dr
- 11663 S Lewis Dr
- 11660 Gleason Rd
- 11645 Gleason Rd
- 11620 Gleason Rd
- 11620 S Gleason Rd
- 11635 Gleason Rd
- 11677 S Lewis Dr
- 11653 S Lewis Dr
- 11655 Gleason Rd
- 11670 Gleason Rd
- 11670 S Gleason Rd
- 11625 Gleason Rd
- 11610 Gleason Rd
- 11643 S Lewis Dr
- 11665 Gleason Rd