
Landlord's Agent in 2023
Mrs. THUY ANH VU
Better Homes and Gardens Real Estate Premier
(703) 989-0739
7 Total Sales
Estimated Value: $272,000
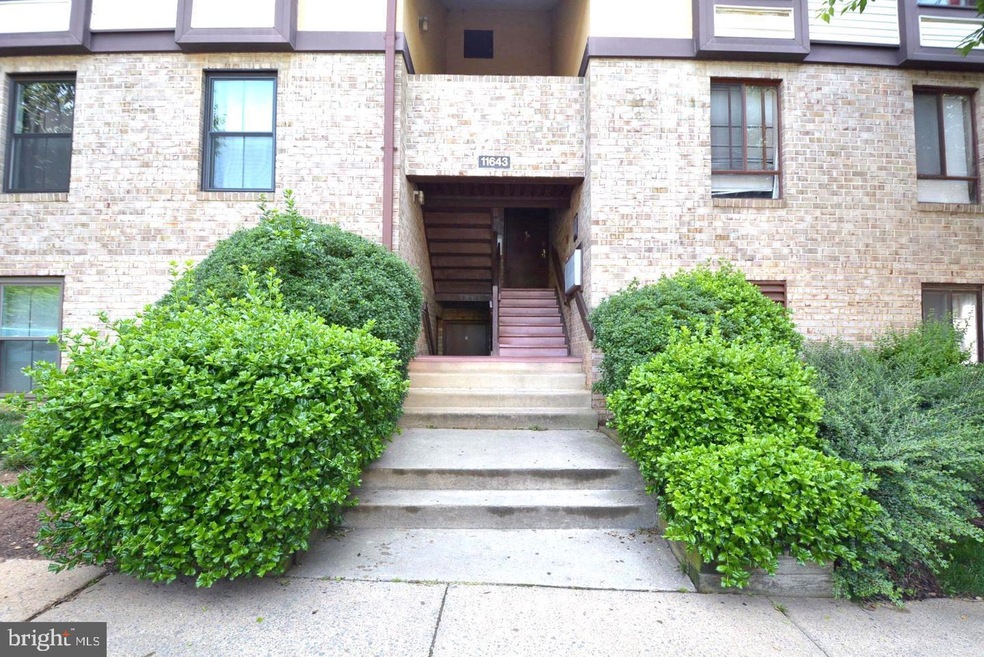
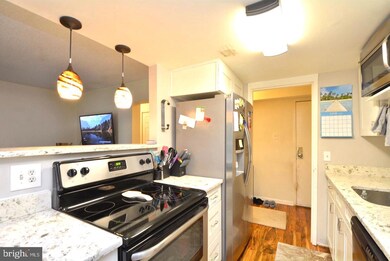
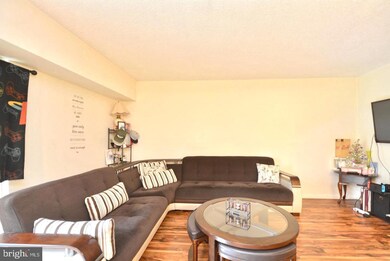
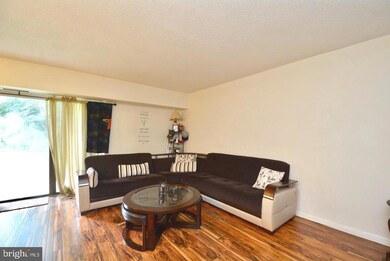
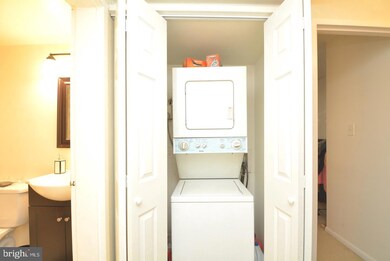
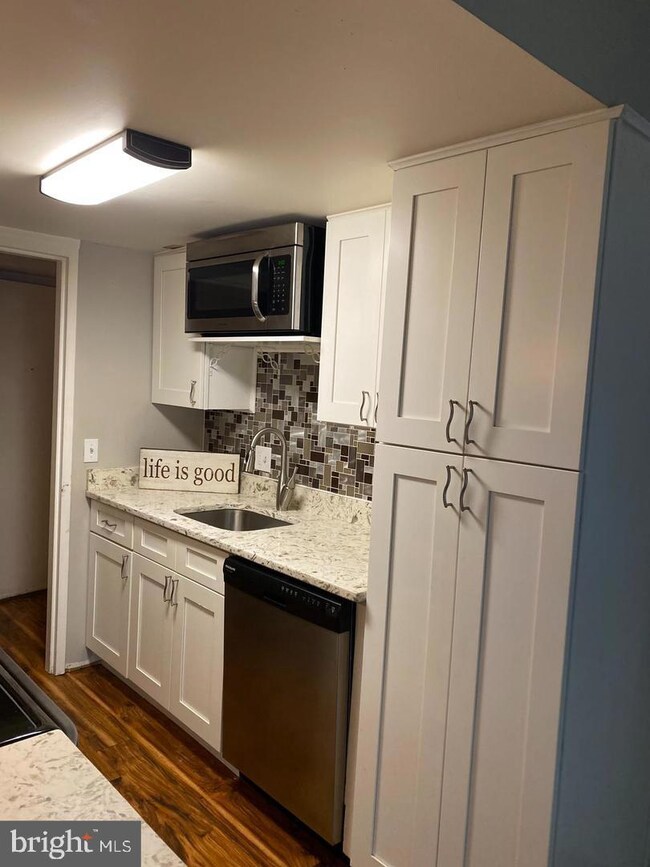
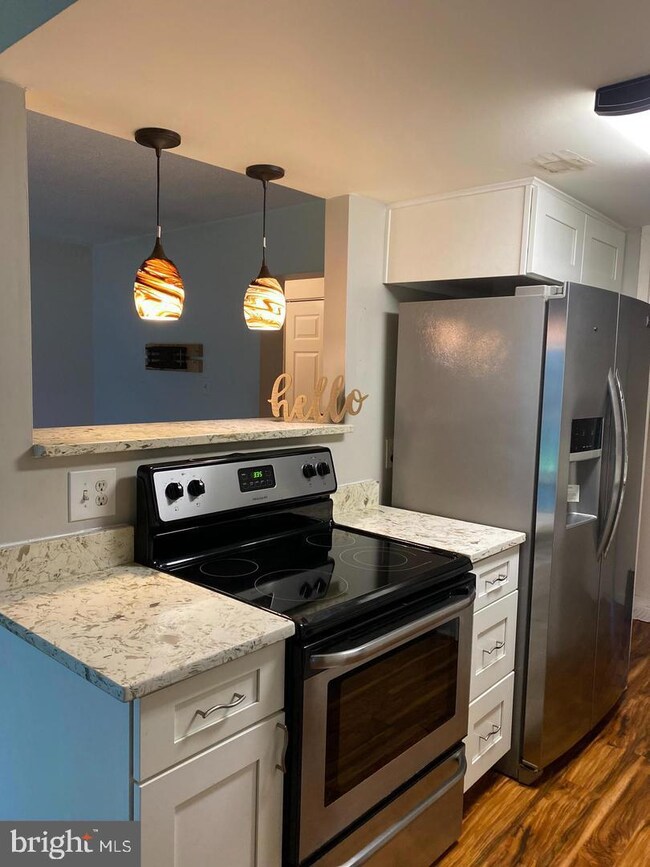
Vacant and Ready to move in in Reston. RENT INCLUDES ALL UTILITIES except phone and internet. Stainless steel appliances, quartz countertop, tile backsplash, carpet in the bedrooms, laminate in the kitchen, living room, dining room, and hallway, as well as floor and wall tile in both bathrooms. On top of this, it also backs onto mature trees. It is just steps away from desirable amenities, nearby shopping centers, public transit, and the stunning Washington & Old Dominion Bike/Jog Trail. Don't miss out on your chance to live conveniently close to everything Reston offers — pools, parks, and the Metro. Park at #362.
Last Agent to Rent the Property
(703) 989-0739 anhvurealtor82@gmail.com Better Homes and Gardens Real Estate Premier License #0225245120 Listed on: 02/05/2023
Last Renter's Agent
(616) 570-5744 kevinmaloneyrealtor@gmail.com Samson Properties License #0225250206
| Date | Buyer | Sale Price | Title Company |
|---|---|---|---|
| Cao Ly Cong | $215,000 | Psr Title Llc | |
| Courouki Elinaz | $100,000 | -- |
| Date | Status | Borrower | Loan Amount |
|---|---|---|---|
| Open | Cao Ly Cong | $161,250 |
| Date | Event | Price | List to Sale | Price per Sq Ft |
|---|---|---|---|---|
| 05/08/2023 05/08/23 | Rented | $2,000 | 0.0% | -- |
| 05/02/2023 05/02/23 | Under Contract | -- | -- | -- |
| 02/22/2023 02/22/23 | Price Changed | $2,000 | -4.8% | $2 / Sq Ft |
| 02/05/2023 02/05/23 | For Rent | $2,100 | -- | -- |
| Year | Tax Paid | Tax Assessment Tax Assessment Total Assessment is a certain percentage of the fair market value that is determined by local assessors to be the total taxable value of land and additions on the property. | Land | Improvement |
|---|---|---|---|---|
| 2025 | $2,763 | $259,960 | $52,000 | $207,960 |
| 2024 | $2,763 | $229,240 | $46,000 | $183,240 |
| 2023 | $2,566 | $218,320 | $44,000 | $174,320 |
| 2022 | $2,452 | $205,960 | $41,000 | $164,960 |
| 2021 | $2,394 | $196,150 | $39,000 | $157,150 |
| 2020 | $2,277 | $185,050 | $37,000 | $148,050 |
| 2019 | $2,202 | $178,970 | $33,000 | $145,970 |
| 2018 | $1,923 | $167,260 | $33,000 | $134,260 |
| 2017 | $1,851 | $153,260 | $31,000 | $122,260 |
| 2016 | $1,890 | $156,780 | $31,000 | $125,780 |
| 2015 | $1,861 | $159,980 | $32,000 | $127,980 |
| 2014 | $1,736 | $149,610 | $30,000 | $119,610 |
Landlord's Agent in 2023
Mrs. THUY ANH VU
Better Homes and Gardens Real Estate Premier
(703) 989-0739
7 Total Sales
Tenant's Agent in 2023
Kevin Maloney
Samson Properties
(616) 570-5744
4 Total Sales
Source: Bright MLS
MLS Number: VAFX2111752
APN: 0262-07860002B
Disclaimer: Certain information contained herein is derived from information provided by parties other than Homes.com. All information provided is deemed reliable, but is not guaranteed to be accurate and should be independently verified.
![]() The data relating to real estate for sale on this website appears in part through the BRIGHT Internet Data Exchange program, a voluntary cooperative exchange of property listing data between licensed real estate brokerage firms, and is provided by BRIGHT through a licensing agreement.
The data relating to real estate for sale on this website appears in part through the BRIGHT Internet Data Exchange program, a voluntary cooperative exchange of property listing data between licensed real estate brokerage firms, and is provided by BRIGHT through a licensing agreement.
Listing information is from various brokers who participate in the Bright MLS IDX program and not all listings may be visible on the site.
The property information being provided on or through the website is for the personal, non-commercial use of consumers and such information may not be used for any purpose other than to identify prospective properties consumers may be interested in purchasing.
Some properties which appear for sale on the website may no longer be available because they are for instance, under contract, sold or are no longer being offered for sale.
Property information displayed is deemed reliable but is not guaranteed.
Copyright 2025 Bright MLS, Inc.