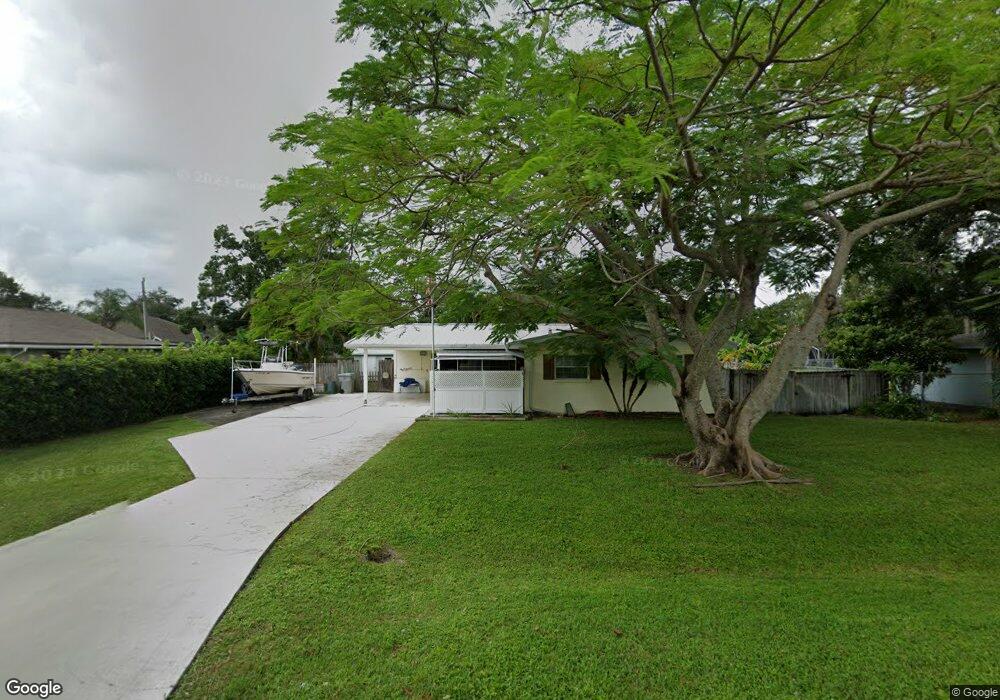
1165 42nd Ave Vero Beach, FL 32960
Estimated Value: $258,000 - $361,000
4
Beds
2
Baths
1,730
Sq Ft
$172/Sq Ft
Est. Value
About This Home
This home is located at 1165 42nd Ave, Vero Beach, FL 32960 and is currently estimated at $298,232, approximately $172 per square foot. 1165 42nd Ave is a home located in Indian River County with nearby schools including Glendale Elementary School, Storm Grove Middle School, and Vero Beach High School.
Ownership History
Date
Name
Owned For
Owner Type
Purchase Details
Closed on
Oct 22, 2015
Sold by
Saville Emma and Saville David
Bought by
Saville David
Current Estimated Value
Purchase Details
Closed on
Sep 24, 1999
Sold by
Davis Dixie A
Bought by
Saville David F and Saville Emma L
Home Financials for this Owner
Home Financials are based on the most recent Mortgage that was taken out on this home.
Original Mortgage
$84,000
Outstanding Balance
$25,037
Interest Rate
7.89%
Mortgage Type
VA
Estimated Equity
$273,195
Purchase Details
Closed on
Nov 10, 1995
Sold by
Aderman Roger J and Aderman Sharon Baker
Bought by
Davis Dixie A
Home Financials for this Owner
Home Financials are based on the most recent Mortgage that was taken out on this home.
Original Mortgage
$59,139
Interest Rate
7.54%
Create a Home Valuation Report for This Property
The Home Valuation Report is an in-depth analysis detailing your home's value as well as a comparison with similar homes in the area
Home Values in the Area
Average Home Value in this Area
Purchase History
| Date | Buyer | Sale Price | Title Company |
|---|---|---|---|
| Saville David | -- | None Available | |
| Saville David F | $84,000 | -- | |
| Davis Dixie A | $67,500 | -- |
Source: Public Records
Mortgage History
| Date | Status | Borrower | Loan Amount |
|---|---|---|---|
| Open | Saville David F | $84,000 | |
| Previous Owner | Davis Dixie A | $59,139 |
Source: Public Records
Tax History Compared to Growth
Tax History
| Year | Tax Paid | Tax Assessment Tax Assessment Total Assessment is a certain percentage of the fair market value that is determined by local assessors to be the total taxable value of land and additions on the property. | Land | Improvement |
|---|---|---|---|---|
| 2024 | $870 | $94,869 | -- | -- |
| 2023 | $870 | $89,510 | $0 | $0 |
| 2022 | $836 | $86,903 | $0 | $0 |
| 2021 | $811 | $84,372 | $0 | $0 |
| 2020 | $795 | $83,207 | $0 | $0 |
| 2019 | $781 | $81,336 | $0 | $0 |
| 2018 | $765 | $79,820 | $0 | $0 |
| 2017 | $746 | $78,178 | $0 | $0 |
| 2016 | $728 | $76,570 | $0 | $0 |
| 2015 | $751 | $76,040 | $0 | $0 |
| 2014 | $713 | $75,440 | $0 | $0 |
Source: Public Records
Map
Nearby Homes