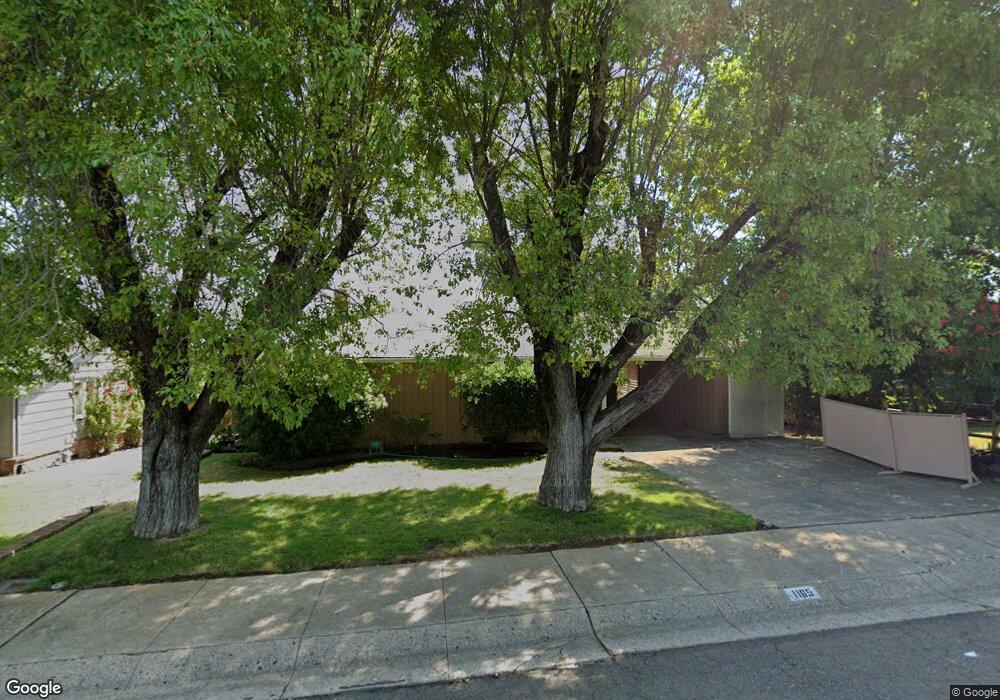
1165 Hillcrest Ave Redding, CA 96001
Manzanita NeighborhoodEstimated Value: $279,000 - $331,000
2
Beds
2
Baths
1,304
Sq Ft
$234/Sq Ft
Est. Value
About This Home
This home is located at 1165 Hillcrest Ave, Redding, CA 96001 and is currently estimated at $305,120, approximately $233 per square foot. 1165 Hillcrest Ave is a home located in Shasta County with nearby schools including Manzanita Elementary School, Sequoia Middle School, and Shasta High School.
Ownership History
Date
Name
Owned For
Owner Type
Purchase Details
Closed on
May 6, 2024
Sold by
Bross David H
Bought by
Weber Beverly Elizabeth
Current Estimated Value
Home Financials for this Owner
Home Financials are based on the most recent Mortgage that was taken out on this home.
Original Mortgage
$187,600
Outstanding Balance
$187,538
Interest Rate
6.82%
Mortgage Type
New Conventional
Estimated Equity
$117,582
Purchase Details
Closed on
Mar 5, 2024
Sold by
Bross Denise Kathryn
Bought by
Bross David H
Purchase Details
Closed on
Apr 24, 2009
Sold by
Bross Denise K
Bought by
Bross Denise K
Home Financials for this Owner
Home Financials are based on the most recent Mortgage that was taken out on this home.
Original Mortgage
$255,000
Interest Rate
3.44%
Mortgage Type
Reverse Mortgage Home Equity Conversion Mortgage
Purchase Details
Closed on
Aug 11, 2005
Sold by
Bross Denise K and Bross David H
Bought by
Bross Denise K
Create a Home Valuation Report for This Property
The Home Valuation Report is an in-depth analysis detailing your home's value as well as a comparison with similar homes in the area
Home Values in the Area
Average Home Value in this Area
Purchase History
We collect this data history from publicly available records. To have your information removed, we recommend requesting removal directly through your county’s website.
| Date | Buyer | Sale Price | Title Company |
|---|---|---|---|
| Weber Beverly Elizabeth | $268,000 | Placer Title | |
| Bross David H | -- | None Listed On Document | |
| Bross Denise K | -- | Ticor Title Company | |
| Bross Denise K | -- | -- |
Source: Public Records
Mortgage History
We collect this data history from publicly available records. To have your information removed, we recommend requesting removal directly through your county’s website.
| Date | Status | Borrower | Loan Amount |
|---|---|---|---|
| Open | Weber Beverly Elizabeth | $187,600 | |
| Previous Owner | Bross Denise K | $255,000 |
Source: Public Records
Tax History
| Year | Tax Paid | Tax Assessment Tax Assessment Total Assessment is a certain percentage of the fair market value that is determined by local assessors to be the total taxable value of land and additions on the property. | Land | Improvement |
|---|---|---|---|---|
| 2025 | $3,126 | $273,360 | $45,900 | $227,460 |
| 2024 | $577 | $295,800 | $40,800 | $255,000 |
| 2023 | $577 | $58,257 | $11,215 | $47,042 |
| 2022 | $565 | $57,116 | $10,996 | $46,120 |
| 2021 | $560 | $55,997 | $10,781 | $45,216 |
| 2020 | $566 | $55,424 | $10,671 | $44,753 |
| 2019 | $536 | $54,338 | $10,462 | $43,876 |
| 2018 | $539 | $53,273 | $10,257 | $43,016 |
| 2017 | $534 | $52,229 | $10,056 | $42,173 |
| 2016 | $516 | $51,206 | $9,859 | $41,347 |
| 2015 | $508 | $50,437 | $9,711 | $40,726 |
| 2014 | $503 | $49,450 | $9,521 | $39,929 |
Source: Public Records
Map
Nearby Homes
- 2565 North St
- 1425 Pleasant St
- 3126 Riesling Path
- 1525 Oak St
- 1355 Bambury Ct
- 3197 Pinot Path
- 2351 Eureka Way
- 1170 Orange Ave
- 3345 Oakwood Place
- 1747&1745 Pleasant St
- 1523 Olive Ave
- 2255 North St
- 1545 Olive Ave
- 2327 Butte St
- 2315 Butte St
- 1129 Magnolia Ave
- 3380 Placer St
- 3510 Eureka Way
- 3330 Scenic Dr
- 3701 Cal Ore Dr
- 1220 Lombard Trail Unit LOT 12
- 1220 Lombard Trail
- 1238 Lombard Trail
- 1202 Lombard Trail
- 1165 Manzanita Hills Ave
- 1155 Manzanita Hills Ave
- 1225 Lombard Trail
- 1175 Manzanita Hills Ave
- 1205 Manzanita Hills Ave
- 1135 Manzanita Hills Ave
- 0 Lombard Trail
- 1256 Lombard Trail
- 2796 Shasta St
- 1225 Manzanita Hills Ave
- 1125 Manzanita Hills Ave
- 1125 Manzanita Hills Ave
- 1265 Lombard Trail
- 2911 Monte Bello Dr
- 1235 Manzanita Hills Ave
- 1274 Lombard Trail
Your Personal Tour Guide
Ask me questions while you tour the home.