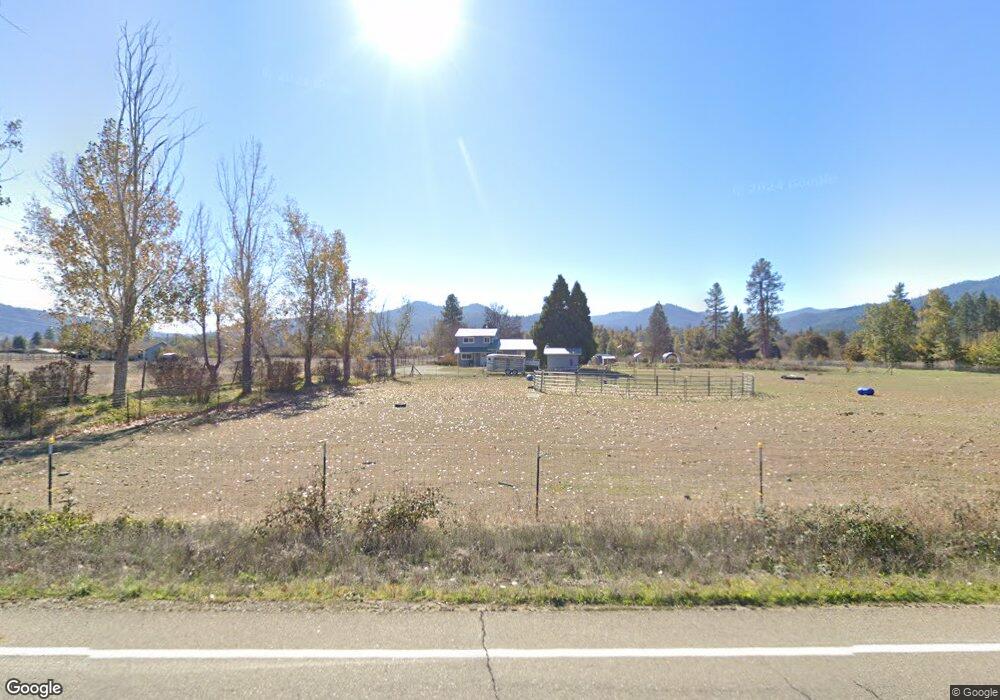
1165 Hyampom Rd Hayfork, CA 96041
Estimated Value: $171,000 - $257,000
3
Beds
--
Bath
1,664
Sq Ft
$136/Sq Ft
Est. Value
About This Home
This home is located at 1165 Hyampom Rd, Hayfork, CA 96041 and is currently estimated at $226,636, approximately $136 per square foot. 1165 Hyampom Rd is a home with nearby schools including Hayfork High School.
Ownership History
Date
Name
Owned For
Owner Type
Purchase Details
Closed on
Jun 26, 2014
Sold by
Hodghead Janice C and Hodghead Kathryn A
Bought by
Tarbell Ryan and Williamson Audrey
Current Estimated Value
Purchase Details
Closed on
Apr 24, 2004
Sold by
Hodghead Janice C and Hodghead David L
Bought by
County Of Trinity
Purchase Details
Closed on
Jul 9, 2003
Sold by
Hodghead Janice C and Hodghead Kathryn A
Bought by
Hodghead David L and Hodghead Janice C
Home Financials for this Owner
Home Financials are based on the most recent Mortgage that was taken out on this home.
Original Mortgage
$85,000
Interest Rate
5.22%
Mortgage Type
Purchase Money Mortgage
Create a Home Valuation Report for This Property
The Home Valuation Report is an in-depth analysis detailing your home's value as well as a comparison with similar homes in the area
Home Values in the Area
Average Home Value in this Area
Purchase History
| Date | Buyer | Sale Price | Title Company |
|---|---|---|---|
| Tarbell Ryan | $165,000 | Placer Title Company | |
| County Of Trinity | -- | Trinity Co Title Co | |
| Hodghead David L | -- | Trinity Co Title Co |
Source: Public Records
Mortgage History
| Date | Status | Borrower | Loan Amount |
|---|---|---|---|
| Previous Owner | Hodghead David L | $85,000 |
Source: Public Records
Tax History
| Year | Tax Paid | Tax Assessment Tax Assessment Total Assessment is a certain percentage of the fair market value that is determined by local assessors to be the total taxable value of land and additions on the property. | Land | Improvement |
|---|---|---|---|---|
| 2025 | $2,215 | $201,238 | $82,861 | $118,377 |
| 2024 | $2,179 | $197,293 | $81,237 | $116,056 |
| 2023 | $2,179 | $193,426 | $79,645 | $113,781 |
| 2022 | $2,135 | $189,634 | $78,084 | $111,550 |
| 2021 | $1,973 | $185,916 | $76,553 | $109,363 |
| 2020 | $1,922 | $184,011 | $75,769 | $108,242 |
| 2019 | $1,885 | $180,404 | $74,284 | $106,120 |
| 2018 | $1,839 | $176,868 | $72,828 | $104,040 |
| 2017 | $1,890 | $173,400 | $71,400 | $102,000 |
| 2016 | $1,820 | $170,000 | $70,000 | $100,000 |
| 2015 | $1,768 | $165,000 | $65,000 | $100,000 |
| 2014 | $1,388 | $120,087 | $36,211 | $83,876 |
Source: Public Records
Map
Nearby Homes
- 1035,1095 Hyampom Rd
- 1035 Hyampom Rd
- 895 Hyampom Rd
- 121 Cedar Gulch Rd
- 825 Hyampom Rd
- 1200 Hyampom Rd
- 1506 Hyampom Rd
- 1500 Hyampom Rd
- 651 Hyampom Rd
- 290 Horse Tail Hill Rd
- 690 Tule Creek Rd
- 555 Hyampom Rd
- 1596 Hyampom Rd
- 374 Tule Creek Rd
- 300 Horse Tail Hill Rd
- 33 Highland Dr
- 370 Tule Creek Rd
- 19 Highland Dr
Your Personal Tour Guide
Ask me questions while you tour the home.