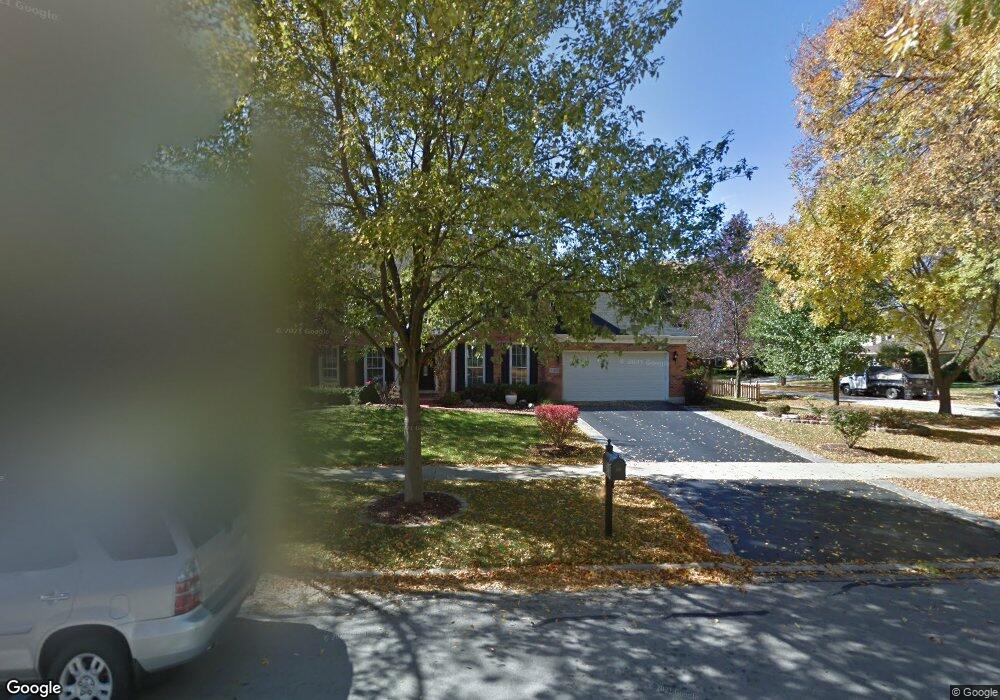
1169 Kenilworth Cir Unit 1 Naperville, IL 60540
Huntington Hill NeighborhoodEstimated Value: $779,538 - $963,000
--
Bed
1
Bath
2,759
Sq Ft
$317/Sq Ft
Est. Value
About This Home
This home is located at 1169 Kenilworth Cir Unit 1, Naperville, IL 60540 and is currently estimated at $875,135, approximately $317 per square foot. 1169 Kenilworth Cir Unit 1 is a home located in DuPage County with nearby schools including Highlands Elementary School, Kennedy Junior High School, and Naperville North High School.
Ownership History
Date
Name
Owned For
Owner Type
Purchase Details
Closed on
Apr 25, 2017
Sold by
Harris Cory A and Harris Jocelyn B
Bought by
Harris Jocelyn B
Current Estimated Value
Home Financials for this Owner
Home Financials are based on the most recent Mortgage that was taken out on this home.
Original Mortgage
$390,000
Outstanding Balance
$324,511
Interest Rate
4.12%
Mortgage Type
New Conventional
Estimated Equity
$550,624
Purchase Details
Closed on
Jan 10, 2011
Sold by
Welch David K and Welch Barbara J
Bought by
Harris Cory A and Harris Jocelyn B
Home Financials for this Owner
Home Financials are based on the most recent Mortgage that was taken out on this home.
Original Mortgage
$374,400
Interest Rate
4.65%
Mortgage Type
New Conventional
Create a Home Valuation Report for This Property
The Home Valuation Report is an in-depth analysis detailing your home's value as well as a comparison with similar homes in the area
Home Values in the Area
Average Home Value in this Area
Purchase History
| Date | Buyer | Sale Price | Title Company |
|---|---|---|---|
| Harris Jocelyn B | -- | Carrington Title Partners Ll | |
| Harris Cory A | $416,000 | First American Title |
Source: Public Records
Mortgage History
| Date | Status | Borrower | Loan Amount |
|---|---|---|---|
| Open | Harris Jocelyn B | $390,000 | |
| Closed | Harris Cory A | $374,400 |
Source: Public Records
Tax History Compared to Growth
Tax History
| Year | Tax Paid | Tax Assessment Tax Assessment Total Assessment is a certain percentage of the fair market value that is determined by local assessors to be the total taxable value of land and additions on the property. | Land | Improvement |
|---|---|---|---|---|
| 2024 | $12,275 | $208,369 | $74,968 | $133,401 |
| 2023 | $11,837 | $190,170 | $68,420 | $121,750 |
| 2022 | $11,919 | $190,170 | $68,420 | $121,750 |
| 2021 | $11,488 | $182,980 | $65,830 | $117,150 |
| 2020 | $11,245 | $179,690 | $64,650 | $115,040 |
| 2019 | $10,920 | $171,910 | $61,850 | $110,060 |
| 2018 | $10,924 | $171,910 | $61,850 | $110,060 |
| 2017 | $10,707 | $166,110 | $59,760 | $106,350 |
| 2016 | $10,497 | $160,110 | $57,600 | $102,510 |
| 2015 | $10,436 | $150,770 | $54,240 | $96,530 |
| 2014 | $10,372 | $145,350 | $52,290 | $93,060 |
| 2013 | $10,216 | $145,700 | $52,420 | $93,280 |
Source: Public Records
Map
Nearby Homes
- 907 Secretariat Dr
- 8S452 Bell Dr
- 923 Tim Tam Cir
- 1006 Bankfield Ct
- 1449 Whitespire Ct Unit 5104
- 1408 Swallow St
- 625 Edward Rd
- 1216 Tranquility Ct
- 908 Julian Ct
- 1300 Old Dominion Rd
- 1386 Old Dominion Ct
- 616 Driftwood Ct
- 165 Tamarack Ave
- 128 E Bailey Rd Unit G
- 158 E Bailey Rd Unit F
- 820 Prairie Ave
- 1519 77th St
- 138 E Bailey Rd Unit M
- 821 Wellner Rd
- 1323 Auburn Ave
- 1173 Kenilworth Cir
- 940 Stanton Dr
- 1177 Kenilworth Cir
- 1168 Kenilworth Cir
- 1172 Kenilworth Cir
- 934 Stanton Dr
- 1161 Kenilworth Cir
- 945 Stanton Dr
- 1201 Johnson Dr
- 1176 Kenilworth Cir
- 1001 Stanton Dr
- 928 Stanton Dr
- 1205 Johnson Dr
- 941 Stanton Dr
- 1008 Stanton Dr
- 937 Stanton Dr
- 1193 Johnson Dr
- 1005 Stanton Dr
- 944 Byron Ct Unit 2
- 933 Stanton Dr Unit 1