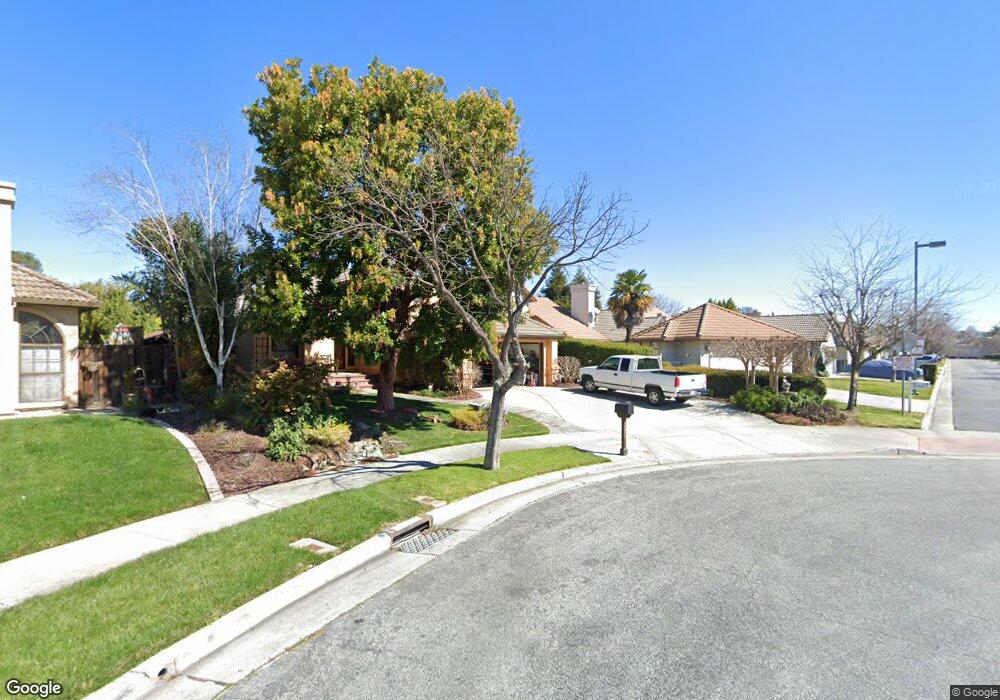
1169 Lerma Ln Gilroy, CA 95020
Las Animas NeighborhoodEstimated Value: $873,389 - $983,000
3
Beds
2
Baths
1,322
Sq Ft
$713/Sq Ft
Est. Value
About This Home
This home is located at 1169 Lerma Ln, Gilroy, CA 95020 and is currently estimated at $943,097, approximately $713 per square foot. 1169 Lerma Ln is a home located in Santa Clara County with nearby schools including Luigi Aprea Elementary School, Brownell Middle School, and Solorsano Middle School.
Ownership History
Date
Name
Owned For
Owner Type
Purchase Details
Closed on
Mar 15, 2013
Sold by
Soh Ka Kwan
Bought by
Soh Ka Kwan and Tan Pamela Hui Min
Current Estimated Value
Purchase Details
Closed on
Aug 24, 2012
Sold by
Soh Ka Kwan
Bought by
Soh Ka Kwan
Home Financials for this Owner
Home Financials are based on the most recent Mortgage that was taken out on this home.
Original Mortgage
$288,000
Outstanding Balance
$197,627
Interest Rate
3.47%
Mortgage Type
New Conventional
Estimated Equity
$745,470
Purchase Details
Closed on
Aug 23, 2012
Sold by
Tan Pamela Hui Min
Bought by
Soh Ka Kwan
Home Financials for this Owner
Home Financials are based on the most recent Mortgage that was taken out on this home.
Original Mortgage
$288,000
Outstanding Balance
$197,627
Interest Rate
3.47%
Mortgage Type
New Conventional
Estimated Equity
$745,470
Purchase Details
Closed on
Apr 23, 2010
Sold by
Filice Cristine
Bought by
Soh Ka Kwan
Home Financials for this Owner
Home Financials are based on the most recent Mortgage that was taken out on this home.
Original Mortgage
$292,000
Interest Rate
4.92%
Mortgage Type
New Conventional
Purchase Details
Closed on
Dec 3, 2001
Sold by
Filice Cristine and Isbell Cristine
Bought by
Filice Cristine
Home Financials for this Owner
Home Financials are based on the most recent Mortgage that was taken out on this home.
Original Mortgage
$216,000
Interest Rate
6.39%
Purchase Details
Closed on
May 5, 1999
Sold by
Ryan Gerome and Ryan Carla S
Bought by
Isbell Ciristine
Home Financials for this Owner
Home Financials are based on the most recent Mortgage that was taken out on this home.
Original Mortgage
$205,000
Interest Rate
6.96%
Purchase Details
Closed on
May 4, 1999
Sold by
Isbell Robert E
Bought by
Isbell Cristine
Home Financials for this Owner
Home Financials are based on the most recent Mortgage that was taken out on this home.
Original Mortgage
$205,000
Interest Rate
6.96%
Purchase Details
Closed on
Jan 10, 1998
Sold by
Gerome Ryan J and Gerome Ryan
Bought by
Gerome Ryan J and Gerome Carla S
Home Financials for this Owner
Home Financials are based on the most recent Mortgage that was taken out on this home.
Original Mortgage
$180,000
Interest Rate
7.14%
Purchase Details
Closed on
Apr 22, 1996
Sold by
Diaz Jose D and Diaz Flora
Bought by
Gerome Ryan and Marsinkavage Carla
Home Financials for this Owner
Home Financials are based on the most recent Mortgage that was taken out on this home.
Original Mortgage
$147,600
Interest Rate
7.84%
Create a Home Valuation Report for This Property
The Home Valuation Report is an in-depth analysis detailing your home's value as well as a comparison with similar homes in the area
Home Values in the Area
Average Home Value in this Area
Purchase History
| Date | Buyer | Sale Price | Title Company |
|---|---|---|---|
| Soh Ka Kwan | -- | None Available | |
| Soh Ka Kwan | -- | Chicago Title Company | |
| Soh Ka Kwan | -- | Chicago Title Company | |
| Soh Ka Kwan | $372,500 | Old Republic Title Company | |
| Filice Cristine | -- | Chicago Title Co | |
| Isbell Ciristine | $272,000 | Old Republic Title Company | |
| Isbell Cristine | -- | Old Republic Title Company | |
| Gerome Ryan J | -- | Chicago Title Co | |
| Gerome Ryan | $184,500 | Chicago Title Co |
Source: Public Records
Mortgage History
| Date | Status | Borrower | Loan Amount |
|---|---|---|---|
| Open | Soh Ka Kwan | $288,000 | |
| Closed | Soh Ka Kwan | $288,000 | |
| Previous Owner | Soh Ka Kwan | $292,000 | |
| Previous Owner | Filice Cristine | $216,000 | |
| Previous Owner | Isbell Ciristine | $205,000 | |
| Previous Owner | Gerome Ryan J | $180,000 | |
| Previous Owner | Gerome Ryan | $147,600 |
Source: Public Records
Tax History Compared to Growth
Tax History
| Year | Tax Paid | Tax Assessment Tax Assessment Total Assessment is a certain percentage of the fair market value that is determined by local assessors to be the total taxable value of land and additions on the property. | Land | Improvement |
|---|---|---|---|---|
| 2025 | $5,821 | $480,815 | $258,155 | $222,660 |
| 2024 | $5,821 | $471,389 | $253,094 | $218,295 |
| 2023 | $5,821 | $462,147 | $248,132 | $214,015 |
| 2022 | $5,688 | $453,086 | $243,267 | $209,819 |
| 2021 | $5,660 | $444,203 | $238,498 | $205,705 |
| 2020 | $5,597 | $439,649 | $236,053 | $203,596 |
| 2019 | $5,544 | $431,029 | $231,425 | $199,604 |
| 2018 | $5,177 | $422,579 | $226,888 | $195,691 |
| 2017 | $5,283 | $414,294 | $222,440 | $191,854 |
| 2016 | $5,173 | $406,172 | $218,079 | $188,093 |
| 2015 | $4,880 | $400,072 | $214,804 | $185,268 |
| 2014 | $4,848 | $392,236 | $210,597 | $181,639 |
Source: Public Records
Map
Nearby Homes
- 9214 Orinda Way
- 1206 Sycamore Ct
- 9360 Benbow Dr
- 820 Woodcreek Way
- 1473 Pheasant Dr
- 1297 Chesbro Way
- 1620 Welburn Ave
- 9565 Grande Dr
- 1501 Welburn Ave
- 9632 Cherrywood Ct
- 1080 Sunrise Dr
- 9650 Santa Teresa Blvd
- 8940 Acorn Way
- 1469 Eagles Nest Ln
- 821 Koshare St
- 1796 Colony Way
- 958 Bosco Ln Unit 1603
- 1925 Mantelli Dr
- 8341 Winter Green Ct
- 8320 Chantrelle Ct
- 1167 Lerma Ln
- 1171 Lerma Ln
- 1165 Lerma Ln
- 9098 Soledad St
- 1144 Valbusa Dr
- 1181 Lerma Ln
- 1163 Lerma Ln
- 1148 Valbusa Dr
- 1140 Valbusa Dr
- 9090 Soledad St
- 1161 Lerma Ln
- 1150 Valbusa Dr
- 1162 Lerma Ln
- 1134 Valbusa Dr
- 1191 Lerma Ln
- 1159 Lerma Ln
- 9088 Soledad St
- 9099 Soledad St
- 1154 Valbusa Dr
- 1137 Del Oro Way