Estimated Value: $141,000 - $233,000
3
Beds
1
Bath
1,136
Sq Ft
$160/Sq Ft
Est. Value
About This Home
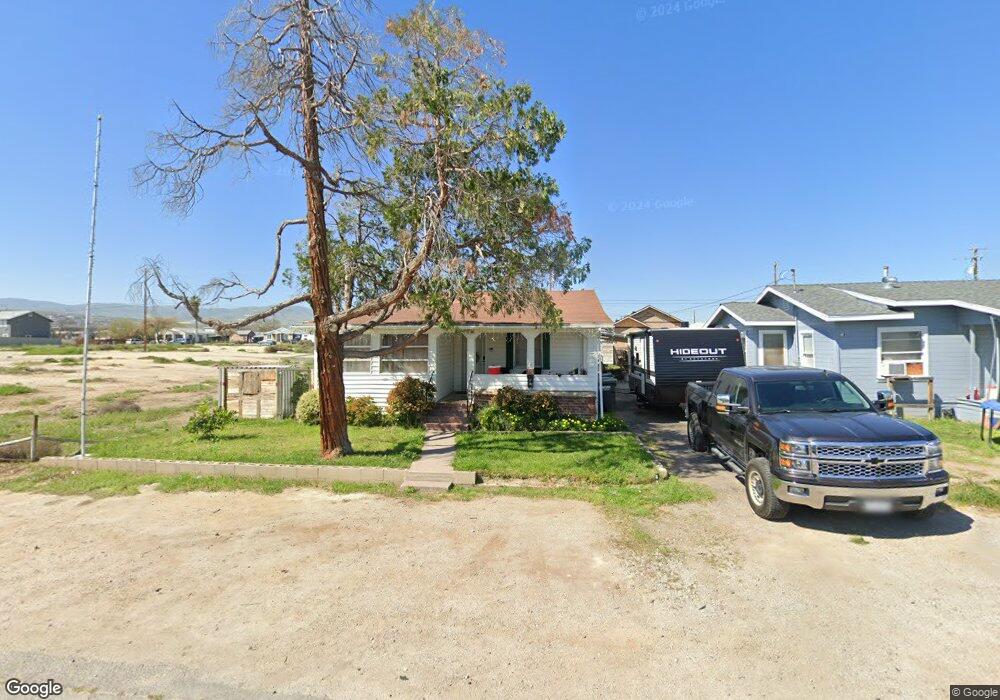
This home is located at 117 1/2 Tyler St, Taft, CA 93268 and is currently estimated at $182,106, approximately $160 per square foot. 117 1/2 Tyler St is a home located in Kern County with nearby schools including Jefferson Elementary School, Roosevelt Elementary School, and Lincoln Junior High School.
Ownership History
Date
Name
Owned For
Owner Type
Purchase Details
Closed on
Nov 18, 2010
Sold by
Ridgway Teryl J
Bought by
Ridgway Teryl J and Teryl J Ridgway Trust
Current Estimated Value
Purchase Details
Closed on
Jul 7, 2009
Sold by
Ridgway Teryl and The Linae Ridgway Revocable Tr
Bought by
Ridgway Teryl
Purchase Details
Closed on
Jul 16, 1999
Sold by
Ridgway Teryl J
Bought by
Ridgway Linae
Purchase Details
Closed on
Jul 9, 1999
Sold by
Ridgway Linae J
Bought by
Ridgway Linae and Linae Ridgway Revocable Trust
Purchase Details
Closed on
May 31, 1996
Sold by
Ridgway Linae J
Bought by
Ridgway O L and Ridgway Linae J
Create a Home Valuation Report for This Property
The Home Valuation Report is an in-depth analysis detailing your home's value as well as a comparison with similar homes in the area
Home Values in the Area
Average Home Value in this Area
Purchase History
| Date | Buyer | Sale Price | Title Company |
|---|---|---|---|
| Ridgway Teryl J | -- | None Available | |
| Ridgway Teryl | -- | None Available | |
| Ridgway Linae | -- | -- | |
| Ridgway Linae | -- | -- | |
| Ridgway O L | -- | -- |
Source: Public Records
Tax History
| Year | Tax Paid | Tax Assessment Tax Assessment Total Assessment is a certain percentage of the fair market value that is determined by local assessors to be the total taxable value of land and additions on the property. | Land | Improvement |
|---|---|---|---|---|
| 2025 | $1,519 | $22,334 | $6,023 | $16,311 |
| 2024 | $1,335 | $21,897 | $5,905 | $15,992 |
| 2023 | $1,335 | $21,469 | $5,790 | $15,679 |
| 2022 | $1,166 | $21,049 | $5,677 | $15,372 |
| 2021 | $1,057 | $20,637 | $5,566 | $15,071 |
| 2020 | $964 | $20,426 | $5,509 | $14,917 |
| 2019 | $942 | $20,426 | $5,509 | $14,917 |
| 2018 | $909 | $19,635 | $5,296 | $14,339 |
| 2017 | $901 | $19,251 | $5,193 | $14,058 |
| 2016 | $885 | $18,875 | $5,092 | $13,783 |
| 2015 | $833 | $18,592 | $5,016 | $13,576 |
| 2014 | $847 | $18,229 | $4,918 | $13,311 |
Source: Public Records
Map
Nearby Homes
Your Personal Tour Guide
Ask me questions while you tour the home.