117 5th St N Edgartown, MA 02539
Edgartown NeighborhoodEstimated Value: $814,000 - $1,687,000
2
Beds
2
Baths
1,359
Sq Ft
$899/Sq Ft
Est. Value
About This Home
This home is located at 117 5th St N, Edgartown, MA 02539 and is currently estimated at $1,221,181, approximately $898 per square foot. 117 5th St N is a home with nearby schools including Edgartown Elementary School and Martha's Vineyard Regional High School.
Ownership History
Date
Name
Owned For
Owner Type
Purchase Details
Closed on
Nov 18, 2024
Sold by
Virginia H Cummings Lt and Robinson
Bought by
Island Vacations Llc
Current Estimated Value
Purchase Details
Closed on
Jan 5, 2023
Sold by
Cummings Virginia H
Bought by
Virginia H Cummings Lt and Cummings
Purchase Details
Closed on
May 5, 1995
Sold by
Roworth Harold C and Roworth Felicia D
Bought by
Cummings Virginia H
Create a Home Valuation Report for This Property
The Home Valuation Report is an in-depth analysis detailing your home's value as well as a comparison with similar homes in the area
Home Values in the Area
Average Home Value in this Area
Purchase History
| Date | Buyer | Sale Price | Title Company |
|---|---|---|---|
| Island Vacations Llc | -- | None Available | |
| Island Vacations Llc | -- | None Available | |
| Virginia H Cummings Lt | -- | None Available | |
| Virginia H Cummings Lt | -- | None Available | |
| Virginia H Cummings Lt | -- | None Available | |
| Cummings Virginia H | $167,000 | -- |
Source: Public Records
Tax History
| Year | Tax Paid | Tax Assessment Tax Assessment Total Assessment is a certain percentage of the fair market value that is determined by local assessors to be the total taxable value of land and additions on the property. | Land | Improvement |
|---|---|---|---|---|
| 2025 | $2,174 | $820,300 | $213,400 | $606,900 |
| 2024 | $2,102 | $824,400 | $213,400 | $611,000 |
| 2023 | $1,879 | $745,500 | $261,400 | $484,100 |
| 2022 | $1,843 | $608,100 | $275,900 | $332,200 |
| 2021 | $2,024 | $617,000 | $250,800 | $366,200 |
| 2020 | $1,725 | $515,000 | $250,800 | $264,200 |
| 2019 | $1,942 | $501,800 | $237,600 | $264,200 |
| 2018 | $1,767 | $456,500 | $232,200 | $224,300 |
| 2017 | $1,637 | $461,100 | $258,000 | $203,100 |
| 2016 | $1,515 | $418,400 | $232,200 | $186,200 |
| 2015 | $1,315 | $378,900 | $217,900 | $161,000 |
Source: Public Records
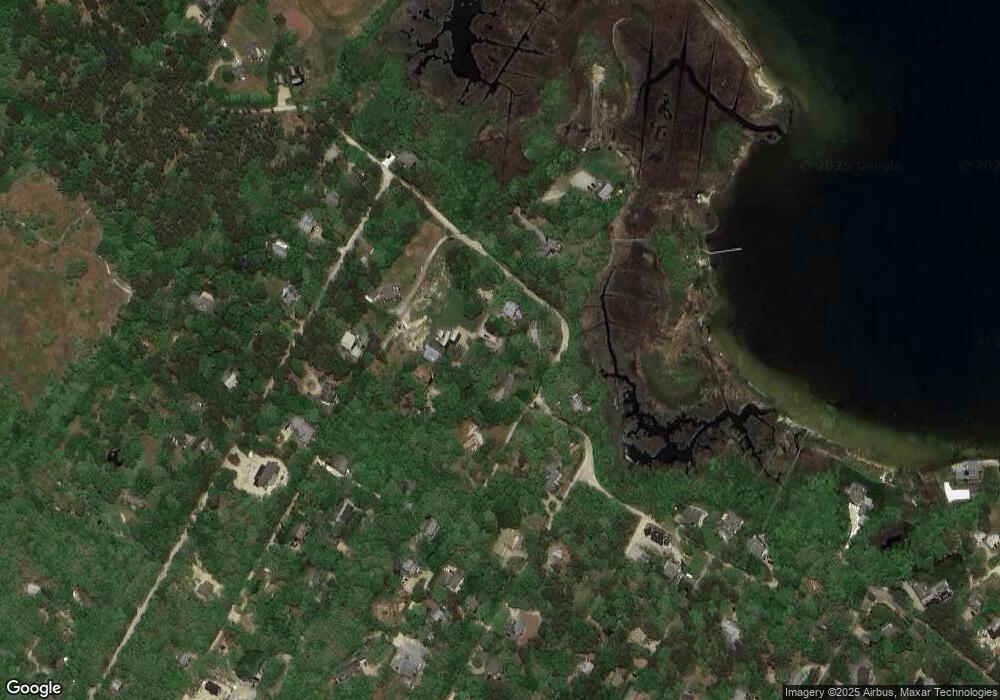
Map
Nearby Homes
- 260 The Blvd
- 112 3rd St N
- 27 7th St N
- 6 Laura's Way
- 6 Lauras Way
- 36 Smith Hollow Dr
- 68 20th St S
- 14 21st St N
- 10 Fowler Ave
- 9 Fowler Ave
- 72 Windsor Dr
- 25 Boylston Dr
- 11 Boylston Dr Unit 1.314
- 11 Boylston Dr
- 36 Boylston Dr
- 36 Boylston Dr Unit 1.329
- 5 Candle Maker Cir
- 5 Candle Maker Cir Unit 1.331
- 400 Edgartown-Vineyard Haven Rd
- 60 Saddle Club Rd