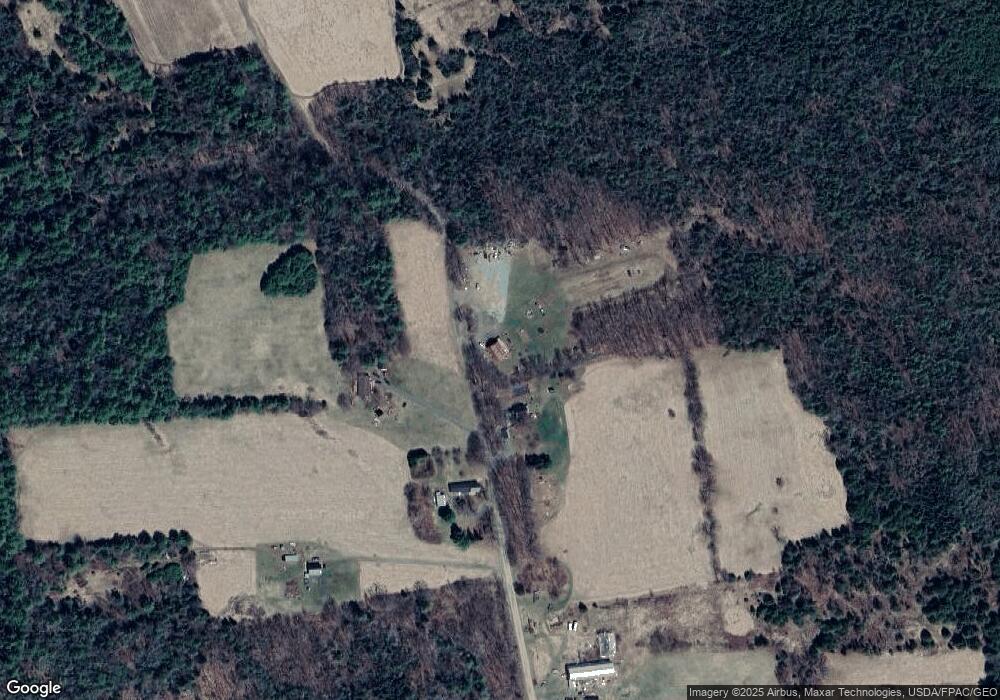
117 Atkins Rd Corinna, ME 04928
Estimated Value: $208,998 - $327,000
3
Beds
2
Baths
2,352
Sq Ft
$117/Sq Ft
Est. Value
About This Home
This home is located at 117 Atkins Rd, Corinna, ME 04928 and is currently estimated at $274,250, approximately $116 per square foot. 117 Atkins Rd is a home located in Penobscot County with nearby schools including Sebasticook Valley Elementary School and Nokomis Regional Middle School/High School.
Ownership History
Date
Name
Owned For
Owner Type
Purchase Details
Closed on
Mar 29, 2019
Sold by
Foster Steven G and Foster Nanci A
Bought by
Foster Mathew P
Current Estimated Value
Home Financials for this Owner
Home Financials are based on the most recent Mortgage that was taken out on this home.
Original Mortgage
$130,000
Outstanding Balance
$114,523
Interest Rate
4.4%
Mortgage Type
Purchase Money Mortgage
Estimated Equity
$159,727
Create a Home Valuation Report for This Property
The Home Valuation Report is an in-depth analysis detailing your home's value as well as a comparison with similar homes in the area
Home Values in the Area
Average Home Value in this Area
Purchase History
| Date | Buyer | Sale Price | Title Company |
|---|---|---|---|
| Foster Mathew P | $170,000 | -- |
Source: Public Records
Mortgage History
| Date | Status | Borrower | Loan Amount |
|---|---|---|---|
| Open | Foster Mathew P | $130,000 |
Source: Public Records
Tax History
| Year | Tax Paid | Tax Assessment Tax Assessment Total Assessment is a certain percentage of the fair market value that is determined by local assessors to be the total taxable value of land and additions on the property. | Land | Improvement |
|---|---|---|---|---|
| 2024 | $2,092 | $105,900 | $37,100 | $68,800 |
| 2023 | $2,067 | $105,900 | $37,100 | $68,800 |
| 2022 | $1,819 | $90,500 | $37,100 | $53,400 |
| 2021 | $1,819 | $90,500 | $37,100 | $53,400 |
| 2020 | $1,810 | $90,500 | $37,100 | $53,400 |
| 2019 | $1,742 | $90,500 | $37,100 | $53,400 |
| 2018 | $1,715 | $90,500 | $37,100 | $53,400 |
| 2017 | $1,741 | $94,600 | $37,100 | $57,500 |
| 2016 | $1,656 | $90,500 | $37,100 | $53,400 |
| 2015 | $1,611 | $90,500 | $37,100 | $53,400 |
| 2014 | $1,548 | $90,500 | $37,100 | $53,400 |
| 2013 | $1,539 | $90,500 | $37,100 | $53,400 |
Source: Public Records
Map
Nearby Homes
Your Personal Tour Guide
Ask me questions while you tour the home.