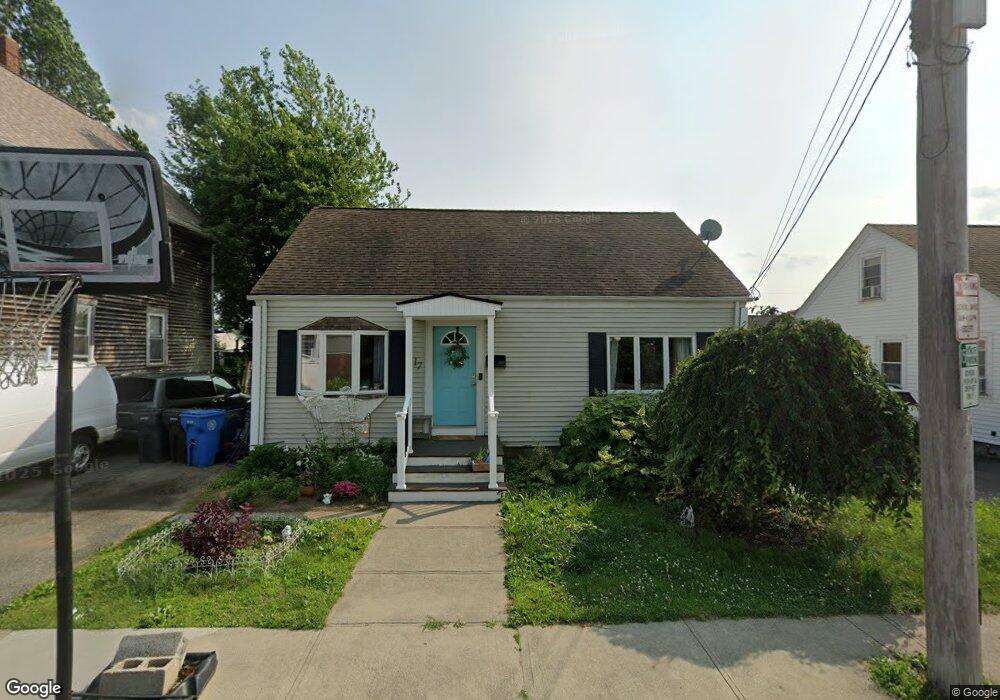
117 Crescent Ave Cranston, RI 02910
Stadium NeighborhoodEstimated Value: $380,000 - $390,000
3
Beds
1
Bath
1,248
Sq Ft
$309/Sq Ft
Est. Value
About This Home
This home is located at 117 Crescent Ave, Cranston, RI 02910 and is currently estimated at $385,827, approximately $309 per square foot. 117 Crescent Ave is a home located in Providence County with nearby schools including Stadium Elementary School, Hugh B. Bain Middle School, and Cranston High School East.
Ownership History
Date
Name
Owned For
Owner Type
Purchase Details
Closed on
Sep 4, 2025
Sold by
Mello Rebecca A and Sullivan Gregory W
Bought by
Felici Raymond D
Current Estimated Value
Home Financials for this Owner
Home Financials are based on the most recent Mortgage that was taken out on this home.
Original Mortgage
$100,000
Outstanding Balance
$99,826
Interest Rate
6.72%
Mortgage Type
Purchase Money Mortgage
Estimated Equity
$286,001
Purchase Details
Closed on
Jan 7, 2014
Sold by
117 Crescent Ave Rt and Sullivan
Bought by
Sullivan Ft and Mello
Purchase Details
Closed on
Mar 31, 2006
Sold by
Felici Raymond
Bought by
Option One Mtg
Home Financials for this Owner
Home Financials are based on the most recent Mortgage that was taken out on this home.
Original Mortgage
$110,000
Interest Rate
6.32%
Mortgage Type
Purchase Money Mortgage
Purchase Details
Closed on
Mar 28, 2006
Sold by
Felici Raymond D
Bought by
Sullivan Carol
Home Financials for this Owner
Home Financials are based on the most recent Mortgage that was taken out on this home.
Original Mortgage
$110,000
Interest Rate
6.32%
Mortgage Type
Purchase Money Mortgage
Purchase Details
Closed on
Jun 12, 1989
Sold by
Archer Mildred G
Bought by
Rodrigues Joseph A
Home Financials for this Owner
Home Financials are based on the most recent Mortgage that was taken out on this home.
Original Mortgage
$80,000
Interest Rate
10.93%
Mortgage Type
Purchase Money Mortgage
Create a Home Valuation Report for This Property
The Home Valuation Report is an in-depth analysis detailing your home's value as well as a comparison with similar homes in the area
Home Values in the Area
Average Home Value in this Area
Purchase History
| Date | Buyer | Sale Price | Title Company |
|---|---|---|---|
| Felici Raymond D | -- | -- | |
| Sullivan Ft | -- | -- | |
| Option One Mtg | $32,000 | -- | |
| Sullivan Carol | $32,000 | -- | |
| Rodrigues Joseph A | $100,000 | -- | |
| Rodrigues Joseph A | $100,000 | -- |
Source: Public Records
Mortgage History
| Date | Status | Borrower | Loan Amount |
|---|---|---|---|
| Open | Felici Raymond D | $100,000 | |
| Previous Owner | Rodrigues Joseph A | $110,000 | |
| Previous Owner | Rodrigues Joseph A | $110,000 | |
| Previous Owner | Rodrigues Joseph A | $80,000 |
Source: Public Records
Tax History Compared to Growth
Tax History
| Year | Tax Paid | Tax Assessment Tax Assessment Total Assessment is a certain percentage of the fair market value that is determined by local assessors to be the total taxable value of land and additions on the property. | Land | Improvement |
|---|---|---|---|---|
| 2025 | $4,281 | $308,400 | $95,200 | $213,200 |
| 2024 | $4,117 | $302,500 | $95,200 | $207,300 |
| 2023 | $4,024 | $212,900 | $65,700 | $147,200 |
| 2022 | $3,941 | $212,900 | $65,700 | $147,200 |
| 2021 | $3,832 | $212,900 | $65,700 | $147,200 |
| 2020 | $3,616 | $174,100 | $62,400 | $111,700 |
| 2019 | $3,616 | $174,100 | $62,400 | $111,700 |
| 2018 | $3,532 | $174,100 | $62,400 | $111,700 |
| 2017 | $3,060 | $133,400 | $46,000 | $87,400 |
| 2016 | $2,995 | $133,400 | $46,000 | $87,400 |
| 2015 | $2,995 | $133,400 | $46,000 | $87,400 |
| 2014 | $3,198 | $140,000 | $46,000 | $94,000 |
Source: Public Records
Map
Nearby Homes