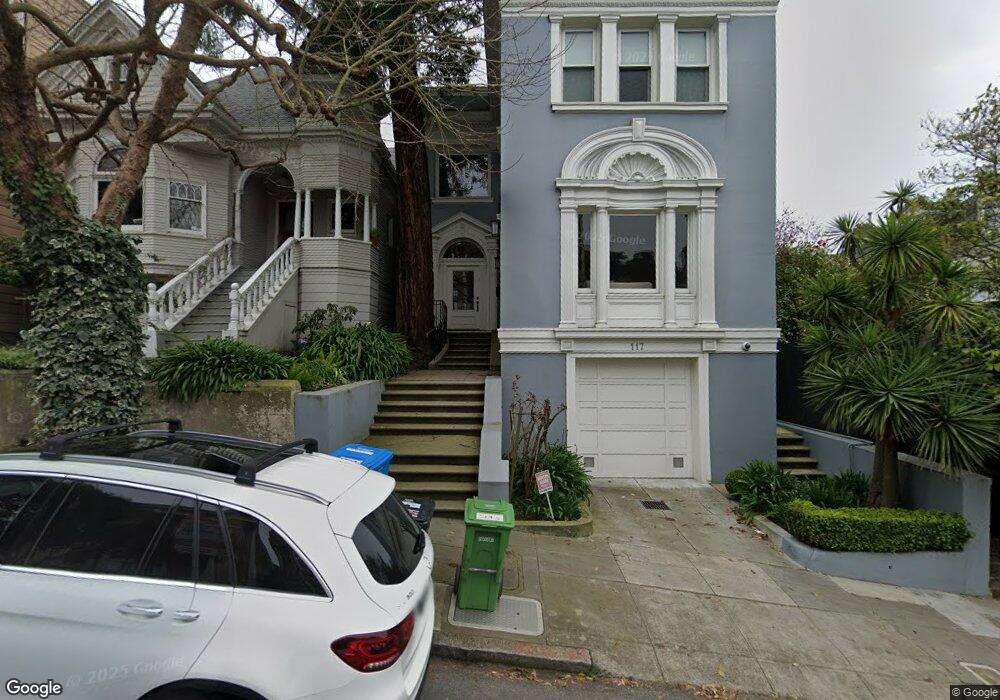
117 Delmar St San Francisco, CA 94117
Buena Vista/Ashbury Heights NeighborhoodEstimated Value: $4,067,000 - $4,588,000
3
Beds
2
Baths
2,900
Sq Ft
$1,515/Sq Ft
Est. Value
About This Home
This home is located at 117 Delmar St, San Francisco, CA 94117 and is currently estimated at $4,394,017, approximately $1,515 per square foot. 117 Delmar St is a home located in San Francisco County with nearby schools including McKinley Elementary School, Everett Middle School, and San Francisco Day School.
Ownership History
Date
Name
Owned For
Owner Type
Purchase Details
Closed on
Oct 25, 2002
Sold by
Gordon Steven and Gordon Alexandra R
Bought by
Gordon Steven Robert and Gordon Alexandra Robert
Current Estimated Value
Purchase Details
Closed on
Mar 22, 2002
Sold by
Dadario Michael J
Bought by
Gordon Steven and Gordon Alexandra R
Home Financials for this Owner
Home Financials are based on the most recent Mortgage that was taken out on this home.
Original Mortgage
$400,000
Outstanding Balance
$157,539
Interest Rate
6.25%
Estimated Equity
$4,236,478
Purchase Details
Closed on
Feb 23, 2001
Sold by
Mitchell B Rev Tr Dadario Michael J Rev Tr; L and Dadario Michael J
Bought by
Dadario Michael J and Laufer Mitchell B
Home Financials for this Owner
Home Financials are based on the most recent Mortgage that was taken out on this home.
Original Mortgage
$215,000
Interest Rate
6.55%
Purchase Details
Closed on
Apr 8, 1998
Sold by
Lauffer Mitchell B
Bought by
Laufer Mitchell B and Mitchell B Lauffer Revocable Trust
Create a Home Valuation Report for This Property
The Home Valuation Report is an in-depth analysis detailing your home's value as well as a comparison with similar homes in the area
Home Values in the Area
Average Home Value in this Area
Purchase History
| Date | Buyer | Sale Price | Title Company |
|---|---|---|---|
| Gordon Steven Robert | -- | -- | |
| Gordon Steven | $1,964,000 | Fidelity National Title Co | |
| Dadario Michael J | -- | First American Title Co | |
| Laufer Mitchell B | -- | -- | |
| Dadario Michael J | -- | -- |
Source: Public Records
Mortgage History
| Date | Status | Borrower | Loan Amount |
|---|---|---|---|
| Open | Gordon Steven | $400,000 | |
| Previous Owner | Dadario Michael J | $215,000 |
Source: Public Records
Tax History Compared to Growth
Tax History
| Year | Tax Paid | Tax Assessment Tax Assessment Total Assessment is a certain percentage of the fair market value that is determined by local assessors to be the total taxable value of land and additions on the property. | Land | Improvement |
|---|---|---|---|---|
| 2025 | $40,567 | $3,470,717 | $1,740,850 | $1,729,867 |
| 2024 | $40,567 | $3,402,665 | $1,706,716 | $1,695,949 |
| 2023 | $39,971 | $3,335,948 | $1,673,251 | $1,662,697 |
| 2022 | $39,234 | $3,270,540 | $1,640,443 | $1,630,097 |
| 2021 | $38,546 | $3,206,414 | $1,608,278 | $1,598,136 |
| 2020 | $38,690 | $3,173,539 | $1,591,788 | $1,581,751 |
| 2019 | $37,355 | $3,111,315 | $1,560,577 | $1,550,738 |
| 2018 | $36,092 | $3,050,310 | $1,529,978 | $1,520,332 |
| 2017 | $35,367 | $2,990,503 | $1,499,979 | $1,490,524 |
| 2016 | $30,129 | $2,532,164 | $1,470,568 | $1,061,596 |
| 2015 | $29,758 | $2,494,129 | $1,448,479 | $1,045,650 |
| 2014 | $28,989 | $2,446,841 | $1,420,106 | $1,026,735 |
Source: Public Records
Map
Nearby Homes
- 1328 Waller St
- 1328-1330 Waller St
- 15 Piedmont St
- 238 Downey St
- 25 Parnassus Ave
- 1015 Ashbury St Unit 4
- 1015 Ashbury St Unit 3
- 529 Clayton St
- 433 Upper Terrace Unit 5
- 1030 Clayton St Unit 2
- 1640 Waller St
- 1024 Masonic Ave
- 1732-1736 Page St
- 1738-1742 Page St
- 1200-1202 Haight St
- 233 Central Ave
- 1809 Oak St
- 226 Roosevelt Way Unit A
- 142 Beulah St
- 44 Museum Way
- 121 Delmar St
- 125 Delmar St
- 119 Frederick St
- 121 Frederick St
- 117 Frederick St Unit Upper
- 820 Ashbury St Unit 2
- 820 Ashbury St Unit 6
- 131 Delmar St
- 806 Ashbury St
- 824 Ashbury St
- 117A Frederick St
- 816 Ashbury St
- 826 Ashbury St
- 115 Frederick St
- 191 Frederick St
- 122 Delmar St
- 124 Delmar St
- 137 Delmar St
- 130 Delmar St
- 848 Ashbury St