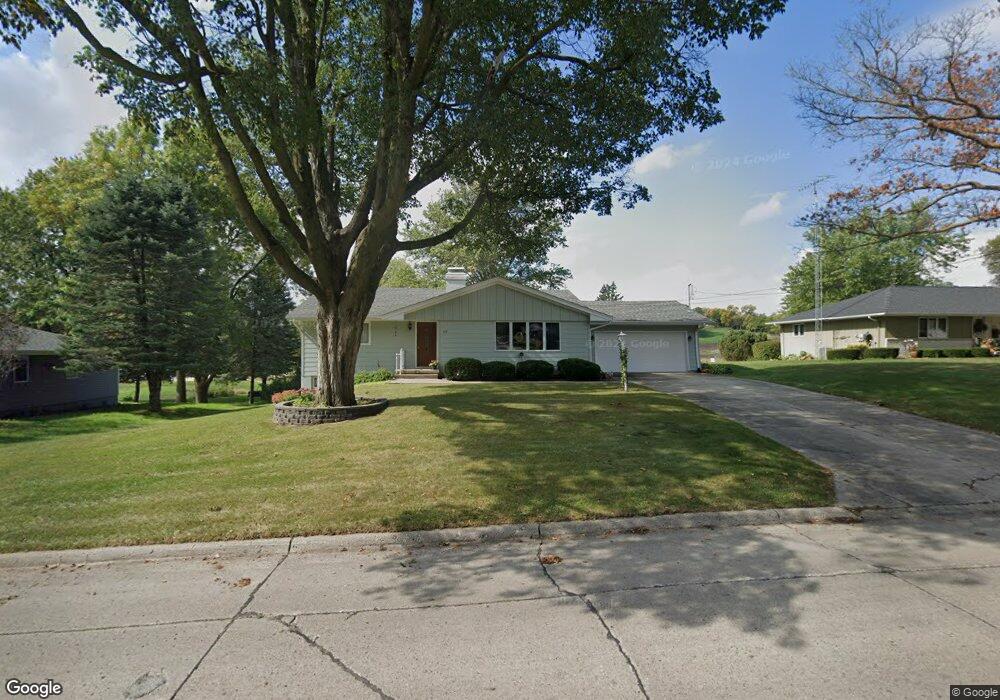
117 E Division St N Audubon, IA 50025
Estimated Value: $192,000 - $200,000
--
Bed
2
Baths
1,332
Sq Ft
$148/Sq Ft
Est. Value
About This Home
This home is located at 117 E Division St N, Audubon, IA 50025 and is currently estimated at $197,124, approximately $147 per square foot. 117 E Division St N is a home located in Audubon County with nearby schools including Audubon Elementary School and Audubon Middle/High School.
Ownership History
Date
Name
Owned For
Owner Type
Purchase Details
Closed on
May 5, 2022
Sold by
Boyajian Pamela J and Boyajian Aram
Bought by
Holloway Jerry
Current Estimated Value
Home Financials for this Owner
Home Financials are based on the most recent Mortgage that was taken out on this home.
Original Mortgage
$105,000
Interest Rate
4.67%
Mortgage Type
Construction
Purchase Details
Closed on
May 1, 2022
Sold by
Weber Robert L and Weber Jane
Bought by
Holloway Jerry
Home Financials for this Owner
Home Financials are based on the most recent Mortgage that was taken out on this home.
Original Mortgage
$105,000
Interest Rate
4.67%
Mortgage Type
Construction
Purchase Details
Closed on
Jul 19, 2018
Sold by
Jean Weber Irma
Bought by
Weber Michael R and Weber Susan E
Create a Home Valuation Report for This Property
The Home Valuation Report is an in-depth analysis detailing your home's value as well as a comparison with similar homes in the area
Home Values in the Area
Average Home Value in this Area
Purchase History
| Date | Buyer | Sale Price | Title Company |
|---|---|---|---|
| Holloway Jerry | -- | None Listed On Document | |
| Holloway Jerry | -- | None Listed On Document | |
| Holloway Jerry | $165,000 | None Listed On Document | |
| Holloway Jerry | -- | None Listed On Document | |
| Weber Michael R | $453,500 | None Listed On Document |
Source: Public Records
Mortgage History
| Date | Status | Borrower | Loan Amount |
|---|---|---|---|
| Closed | Holloway Jerry | $105,000 | |
| Closed | Holloway Jerry | $105,000 |
Source: Public Records
Tax History Compared to Growth
Tax History
| Year | Tax Paid | Tax Assessment Tax Assessment Total Assessment is a certain percentage of the fair market value that is determined by local assessors to be the total taxable value of land and additions on the property. | Land | Improvement |
|---|---|---|---|---|
| 2025 | $2,918 | $196,420 | $15,000 | $181,420 |
| 2024 | $2,918 | $168,160 | $15,000 | $153,160 |
| 2023 | $2,512 | $168,160 | $15,000 | $153,160 |
| 2022 | $2,344 | $116,240 | $15,000 | $101,240 |
| 2021 | $2,344 | $116,240 | $15,000 | $101,240 |
| 2020 | $2,388 | $110,490 | $13,000 | $97,490 |
| 2019 | $2,344 | $100,590 | $0 | $0 |
| 2018 | $2,252 | $100,590 | $0 | $0 |
| 2017 | $2,068 | $88,230 | $0 | $0 |
| 2016 | $1,912 | $88,230 | $0 | $0 |
| 2015 | $1,912 | $88,230 | $0 | $0 |
| 2014 | $1,742 | $88,230 | $0 | $0 |
Source: Public Records
Map
Nearby Homes
- 103 E Division St
- 707 N Arlington St
- 101 Church St
- 706 N Arlington St
- 103 Church St
- 107 & 109 Church St
- 912 Broadway St
- 907 Broadway St
- 108 Nasby Ave
- 102 Nasby Ave
- 1119 N Division St
- 311 2nd Ave
- 415 1st Ave
- 510 E Division St
- 512 1st Ave
- 702 Washington St
- 702 E Division St
- 718 3rd Ave
- 722 3rd Ave
- 313 Mantz Ave
- 117 E Division St N
- 115 E Division St N
- 116 E Division St N
- 118 E Division St N
- 205 E Division St N
- 109 E Division St N
- 112 E Division St N
- 204 E Division St N
- 107 E Division St N
- 707 S Arlington St
- 108 E Division St N
- 106 E Division St N
- 709 S Arlington St
- 706 S Arlington St
- 211 E Division St N
- 104 E Division St N
- 212 E Division St
- 708 S Arlington St
- 211 E Division St Unit NORTH
- 211 E Division St