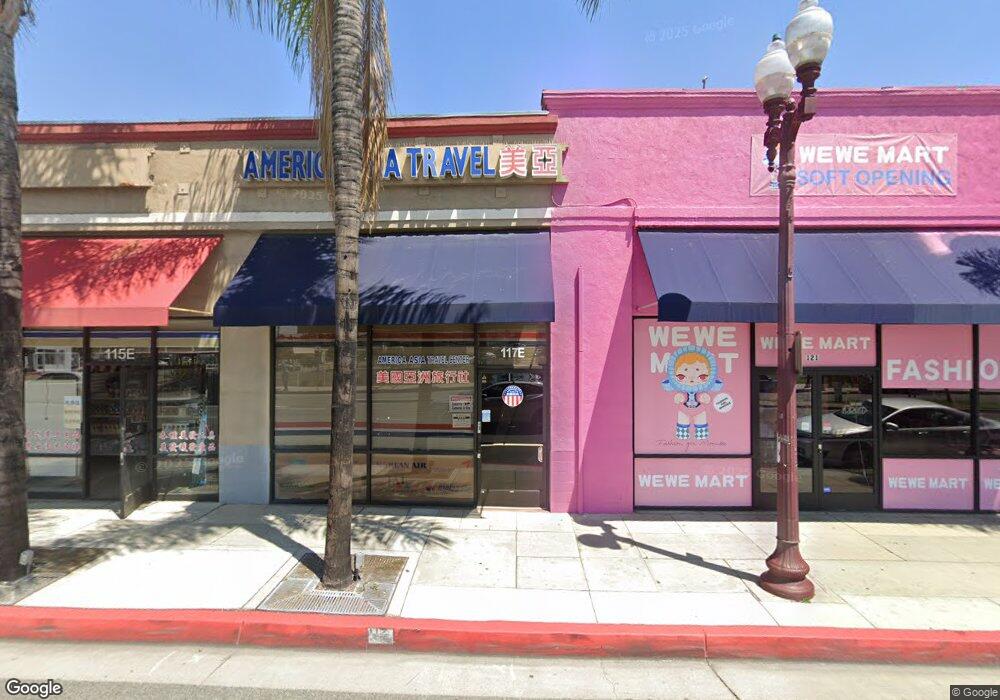
117 E Garvey Ave Monterey Park, CA 91755
Estimated Value: $7,831,666
--
Bed
--
Bath
14,313
Sq Ft
$547/Sq Ft
Est. Value
About This Home
This home is located at 117 E Garvey Ave, Monterey Park, CA 91755 and is currently estimated at $7,831,666, approximately $547 per square foot. 117 E Garvey Ave is a home located in Los Angeles County with nearby schools including Ynez Elementary School, Mark Keppel High School, and St. Stephen Martyr School.
Ownership History
Date
Name
Owned For
Owner Type
Purchase Details
Closed on
Dec 6, 2022
Sold by
Yung Seng Gung Revocable Living Trust
Bought by
Idd Intl Investment Inc
Current Estimated Value
Purchase Details
Closed on
Sep 19, 2022
Sold by
Idd Intl Investment Inc
Bought by
Yung Seng Gung Revocable Living Trust
Purchase Details
Closed on
Dec 27, 2021
Sold by
Aatc & Koo Limited Liability Limited Com
Bought by
Idd Intl Investment Inc
Home Financials for this Owner
Home Financials are based on the most recent Mortgage that was taken out on this home.
Original Mortgage
$4,830,000
Interest Rate
3.12%
Mortgage Type
Commercial
Purchase Details
Closed on
Aug 27, 1997
Sold by
Li Joseph Y
Bought by
Aatc & Koo Ltd Liability Company
Home Financials for this Owner
Home Financials are based on the most recent Mortgage that was taken out on this home.
Original Mortgage
$2,300,000
Interest Rate
7.42%
Mortgage Type
Commercial
Create a Home Valuation Report for This Property
The Home Valuation Report is an in-depth analysis detailing your home's value as well as a comparison with similar homes in the area
Home Values in the Area
Average Home Value in this Area
Purchase History
| Date | Buyer | Sale Price | Title Company |
|---|---|---|---|
| Idd Intl Investment Inc | -- | -- | |
| Yung Seng Gung Revocable Living Trust | -- | -- | |
| Idd Intl Investment Inc | $6,900,000 | Chicago Title | |
| Idd Investment Inc | $6,900,000 | Chicago Title Company | |
| Aatc & Koo Ltd Liability Company | -- | Fidelity Title |
Source: Public Records
Mortgage History
| Date | Status | Borrower | Loan Amount |
|---|---|---|---|
| Previous Owner | Idd Investment Inc | $4,830,000 | |
| Previous Owner | Aatc & Koo Ltd Liability Company | $2,300,000 |
Source: Public Records
Tax History Compared to Growth
Tax History
| Year | Tax Paid | Tax Assessment Tax Assessment Total Assessment is a certain percentage of the fair market value that is determined by local assessors to be the total taxable value of land and additions on the property. | Land | Improvement |
|---|---|---|---|---|
| 2025 | $99,006 | $7,178,760 | $3,641,400 | $3,537,360 |
| 2024 | $99,006 | $7,038,000 | $3,570,000 | $3,468,000 |
| 2023 | $97,008 | $6,900,000 | $3,500,000 | $3,400,000 |
| 2022 | $70,508 | $4,965,434 | $2,810,739 | $2,154,695 |
| 2021 | $69,597 | $4,868,074 | $2,755,627 | $2,112,447 |
| 2019 | $67,199 | $4,723,687 | $2,673,895 | $2,049,792 |
| 2018 | $67,074 | $4,631,066 | $2,621,466 | $2,009,600 |
| 2016 | $61,972 | $4,451,238 | $2,519,672 | $1,931,566 |
| 2015 | $60,918 | $4,384,378 | $2,481,825 | $1,902,553 |
| 2014 | $59,931 | $4,298,495 | $2,433,210 | $1,865,285 |
Source: Public Records
Map
Nearby Homes
- 215 N Lincoln Ave
- 197 N Nicholson Ave
- 203 N Nicholson Ave
- 305 N Baltimore Ave Unit C
- 303 N Nicholson Ave Unit 308
- 215 W Garcelon Ave
- 208 N Nicholson Ave Unit B
- 406 N Lincoln Ave Unit A
- 230 N Nicholson Ave Unit C
- 123 N Alhambra Ave Unit D
- 223 E Emerson Ave
- 421 S Garfield Ave Unit 79
- 418 S Lincoln Ave
- 112 S Sierra Vista St
- 438 S Garfield Ave Unit E
- 433 N Alhambra Ave Unit C
- 412 E Newmark Ave Unit D
- 424 E Newmark Ave Unit B
- 522 N Nicholson Ave Unit A
- 522 N Nicholson Ave Unit A
- 101 E Garvey Ave
- 105 E Garvey Ave
- 121 E Garvey Ave
- 127 E Garvey Ave
- 100 S Garfield Ave
- 114 N Garfield Ave
- 138 E Garvey Ave
- 101 W Garvey Ave Unit 113
- 101 W Garvey Ave
- 123 N Garfield Ave
- 130 N Garfield Ave
- 124 N Garfield Ave
- 128 N Garfield Ave
- 117 W Garvey Ave
- 117 W Garvey Ave Unit C
- 188 E Garvey Ave Unit A
- 103 N Lincoln Ave
- 103 N Lincoln Ave
- 202 N Garfield Ave Unit B
- 202 N Garfield Ave Unit A