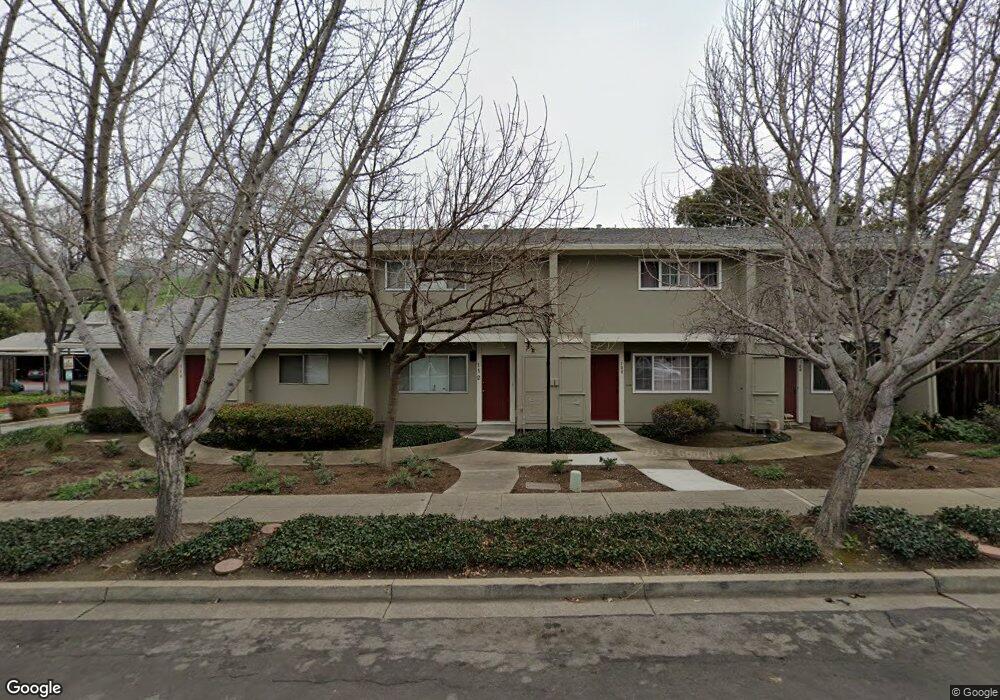
117 Jasmine Ct Milpitas, CA 95035
Estimated Value: $589,000 - $838,000
2
Beds
2
Baths
980
Sq Ft
$713/Sq Ft
Est. Value
About This Home
This home is located at 117 Jasmine Ct, Milpitas, CA 95035 and is currently estimated at $698,690, approximately $712 per square foot. 117 Jasmine Ct is a home located in Santa Clara County with nearby schools including William Burnett Elementary School, Rancho Milpitas Middle School, and Milpitas High School.
Ownership History
Date
Name
Owned For
Owner Type
Purchase Details
Closed on
Feb 20, 2013
Sold by
Tam Hong Cam
Bought by
Tam John Wei Yip
Current Estimated Value
Home Financials for this Owner
Home Financials are based on the most recent Mortgage that was taken out on this home.
Original Mortgage
$210,900
Outstanding Balance
$94,946
Interest Rate
3.34%
Mortgage Type
New Conventional
Estimated Equity
$603,744
Purchase Details
Closed on
Jun 30, 2004
Sold by
Pham Kim
Bought by
Tam John Wei Yip
Home Financials for this Owner
Home Financials are based on the most recent Mortgage that was taken out on this home.
Original Mortgage
$249,600
Interest Rate
5%
Mortgage Type
Purchase Money Mortgage
Purchase Details
Closed on
Mar 4, 1997
Sold by
Obrien Daniel T
Bought by
Pham Kim
Home Financials for this Owner
Home Financials are based on the most recent Mortgage that was taken out on this home.
Original Mortgage
$101,600
Interest Rate
7.9%
Create a Home Valuation Report for This Property
The Home Valuation Report is an in-depth analysis detailing your home's value as well as a comparison with similar homes in the area
Home Values in the Area
Average Home Value in this Area
Purchase History
| Date | Buyer | Sale Price | Title Company |
|---|---|---|---|
| Tam John Wei Yip | -- | Old Republic Title Company | |
| Tam John Wei Yip | -- | Old Republic Title Company | |
| Tam John Wei Yip | $312,000 | Alliance Title Company | |
| Pham Kim | $127,000 | Santa Clara Land Title Co |
Source: Public Records
Mortgage History
| Date | Status | Borrower | Loan Amount |
|---|---|---|---|
| Open | Tam John Wei Yip | $210,900 | |
| Closed | Tam John Wei Yip | $210,900 | |
| Closed | Tam John Wei Yip | $249,600 | |
| Previous Owner | Pham Kim | $101,600 |
Source: Public Records
Tax History
| Year | Tax Paid | Tax Assessment Tax Assessment Total Assessment is a certain percentage of the fair market value that is determined by local assessors to be the total taxable value of land and additions on the property. | Land | Improvement |
|---|---|---|---|---|
| 2025 | $5,007 | $434,877 | $173,947 | $260,930 |
| 2024 | $5,007 | $426,351 | $170,537 | $255,814 |
| 2023 | $4,990 | $417,993 | $167,194 | $250,799 |
| 2022 | $4,973 | $409,798 | $163,916 | $245,882 |
| 2021 | $4,901 | $401,763 | $160,702 | $241,061 |
| 2020 | $4,816 | $397,645 | $159,055 | $238,590 |
| 2019 | $4,761 | $389,849 | $155,937 | $233,912 |
| 2018 | $4,524 | $382,206 | $152,880 | $229,326 |
| 2017 | $4,466 | $374,713 | $149,883 | $224,830 |
| 2016 | $4,282 | $367,367 | $146,945 | $220,422 |
| 2015 | $4,238 | $361,850 | $144,738 | $217,112 |
| 2014 | $3,608 | $310,000 | $124,000 | $186,000 |
Source: Public Records
Map
Nearby Homes
- 25 Terfidia Ln
- 1647 Jupiter Dr
- 258 Lynn Ave
- 136 Lawton Dr
- 1787 Canton Dr
- 1995 Old Calaveras Rd
- 320 Monmouth Dr
- 397 S Park Victoria Dr
- 496 Dempsey Rd Unit 199
- 484 Dempsey Rd Unit 186
- 2202 Yosemite Dr
- 529 Bryce Ct
- 808 Cameron Cir
- 1260 Glacier Dr
- 2235 Skyline Dr
- 1103 Creed St
- 1490 Mount Diablo Ave
- 685 Parvin Dr
- 1000 Jacklin Rd
- 1759 Tahoe Dr
- 113 Jasmine Ct
- 121 Jasmine Ct
- 109 Jasmine Ct
- 1754 Strawberry Ln
- 127 Jasmine Ct
- 1756 Strawberry Ln
- 108 Jasmine Ct
- 116 Jasmine Ct
- 100 Hemlock Ln
- 112 Jasmine Ct
- 1762 Strawberry Ln
- 104 Jasmine Ct
- 131 Jasmine Ct
- 96 Hemlock Ln
- 92 Hemlock Ln
- 1747 Strawberry Ln
- 135 Jasmine Ct
- 1768 Strawberry Ln
- 88 Hemlock Ln
- 1753 Strawberry Ln
Your Personal Tour Guide
Ask me questions while you tour the home.