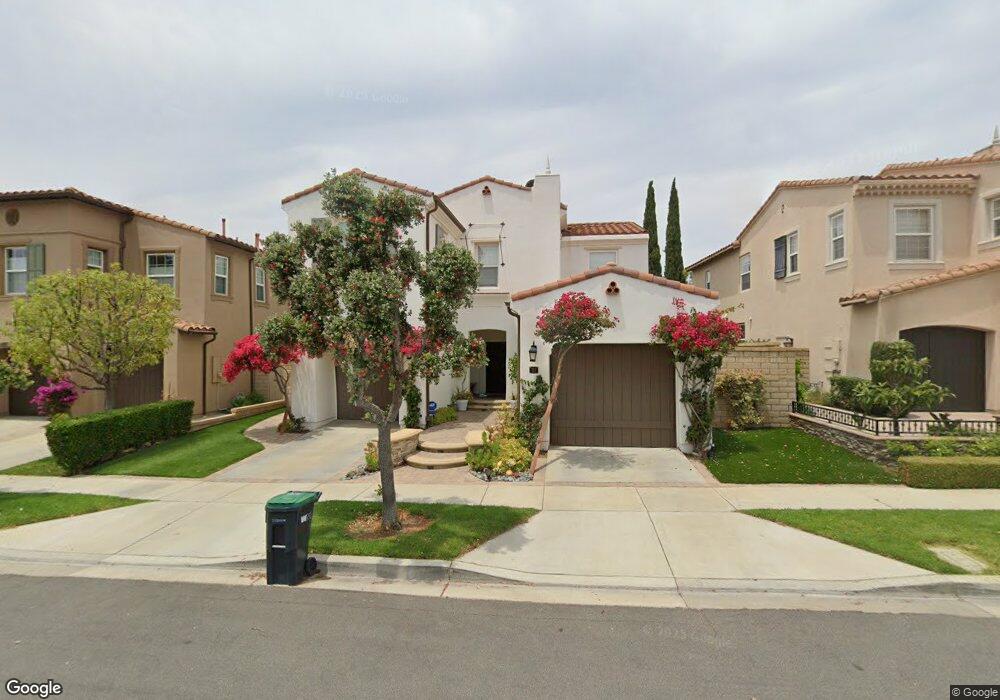
117 Lattice Irvine, CA 92603
Quail Hill NeighborhoodEstimated Value: $2,631,434 - $3,027,000
4
Beds
4
Baths
2,445
Sq Ft
$1,170/Sq Ft
Est. Value
About This Home
This home is located at 117 Lattice, Irvine, CA 92603 and is currently estimated at $2,861,609, approximately $1,170 per square foot. 117 Lattice is a home located in Orange County with nearby schools including Alderwood Elementary, Rancho San Joaquin Middle School, and University High School.
Ownership History
Date
Name
Owned For
Owner Type
Purchase Details
Closed on
Jun 3, 2021
Sold by
Rafi Hamid and Paigah Shahnaz
Bought by
Rafi Hamid and Paigah Shahnaz
Current Estimated Value
Purchase Details
Closed on
Mar 9, 2005
Sold by
Rafi Hamid
Bought by
Rafi Hamid and Paigah Shahnaz
Home Financials for this Owner
Home Financials are based on the most recent Mortgage that was taken out on this home.
Original Mortgage
$650,000
Outstanding Balance
$316,135
Interest Rate
5%
Mortgage Type
Purchase Money Mortgage
Estimated Equity
$2,545,474
Purchase Details
Closed on
Aug 11, 2004
Sold by
California Pacific Homes Inc
Bought by
Rafi Hamid and Paigah Shahnaz
Home Financials for this Owner
Home Financials are based on the most recent Mortgage that was taken out on this home.
Original Mortgage
$650,000
Interest Rate
1%
Mortgage Type
Purchase Money Mortgage
Create a Home Valuation Report for This Property
The Home Valuation Report is an in-depth analysis detailing your home's value as well as a comparison with similar homes in the area
Home Values in the Area
Average Home Value in this Area
Purchase History
| Date | Buyer | Sale Price | Title Company |
|---|---|---|---|
| Rafi Hamid | -- | None Available | |
| Rafi Hamid | -- | Old Republic Title Company | |
| Rafi Hamid | -- | Old Republic Title Company | |
| Rafi Hamid | $995,000 | Fidelity National Title |
Source: Public Records
Mortgage History
| Date | Status | Borrower | Loan Amount |
|---|---|---|---|
| Open | Rafi Hamid | $650,000 | |
| Previous Owner | Rafi Hamid | $650,000 |
Source: Public Records
Tax History Compared to Growth
Tax History
| Year | Tax Paid | Tax Assessment Tax Assessment Total Assessment is a certain percentage of the fair market value that is determined by local assessors to be the total taxable value of land and additions on the property. | Land | Improvement |
|---|---|---|---|---|
| 2025 | $16,813 | $1,386,797 | $971,972 | $414,825 |
| 2024 | $16,813 | $1,359,605 | $952,913 | $406,692 |
| 2023 | $16,495 | $1,332,947 | $934,229 | $398,718 |
| 2022 | $16,181 | $1,306,811 | $915,911 | $390,900 |
| 2021 | $15,922 | $1,281,188 | $897,952 | $383,236 |
| 2020 | $15,766 | $1,268,051 | $888,744 | $379,307 |
| 2019 | $15,496 | $1,243,188 | $871,318 | $371,870 |
| 2018 | $15,224 | $1,218,812 | $854,233 | $364,579 |
| 2017 | $14,950 | $1,194,914 | $837,483 | $357,431 |
| 2016 | $14,687 | $1,171,485 | $821,062 | $350,423 |
| 2015 | $14,416 | $1,153,889 | $808,729 | $345,160 |
| 2014 | $14,419 | $1,131,286 | $792,887 | $338,399 |
Source: Public Records
Map
Nearby Homes