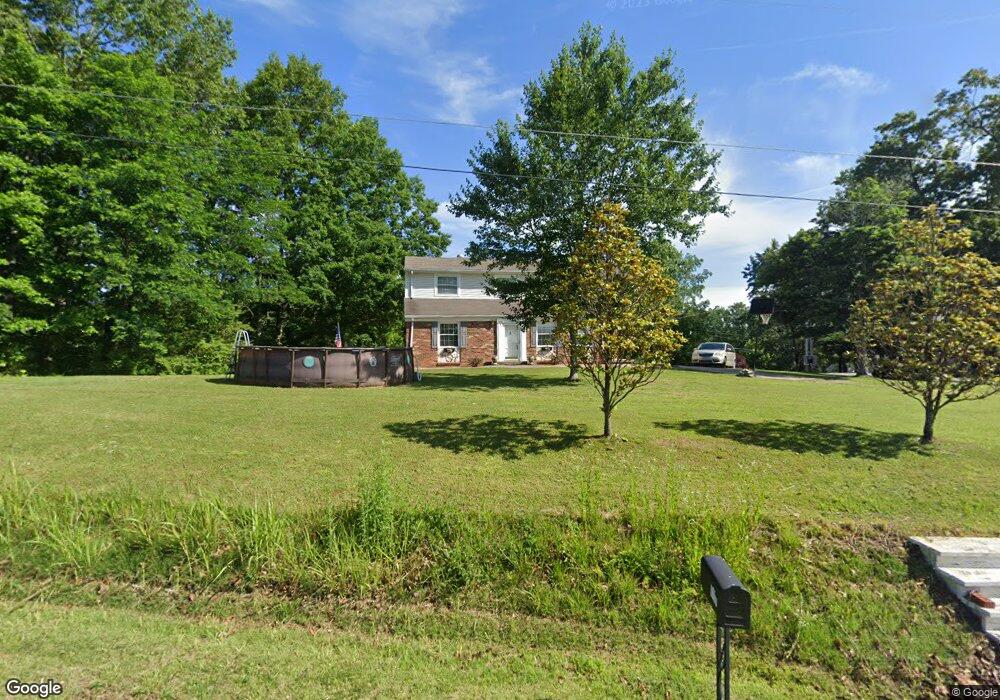
117 Pheasant Hollow Rd Dickson, TN 37055
Estimated Value: $359,000 - $441,000
--
Bed
3
Baths
2,408
Sq Ft
$164/Sq Ft
Est. Value
About This Home
This home is located at 117 Pheasant Hollow Rd, Dickson, TN 37055 and is currently estimated at $395,835, approximately $164 per square foot. 117 Pheasant Hollow Rd is a home located in Dickson County with nearby schools including Stuart Burns Elementary School, Burns Middle School, and Dickson County High School.
Ownership History
Date
Name
Owned For
Owner Type
Purchase Details
Closed on
Mar 28, 2011
Sold by
Federal National Mortgage Association
Bought by
Ryden Jeffrey and Ryden Tracy L
Current Estimated Value
Home Financials for this Owner
Home Financials are based on the most recent Mortgage that was taken out on this home.
Original Mortgage
$98,439
Outstanding Balance
$68,136
Interest Rate
4.87%
Mortgage Type
FHA
Estimated Equity
$327,699
Purchase Details
Closed on
Nov 10, 2009
Sold by
Jessey John M
Bought by
Federal National Mortgage Association
Purchase Details
Closed on
Apr 17, 2008
Sold by
Jessey John M
Bought by
Jessey John M
Purchase Details
Closed on
Feb 2, 2004
Sold by
Underhill William A
Bought by
Jessey John M
Home Financials for this Owner
Home Financials are based on the most recent Mortgage that was taken out on this home.
Original Mortgage
$102,400
Interest Rate
5.77%
Create a Home Valuation Report for This Property
The Home Valuation Report is an in-depth analysis detailing your home's value as well as a comparison with similar homes in the area
Home Values in the Area
Average Home Value in this Area
Purchase History
| Date | Buyer | Sale Price | Title Company |
|---|---|---|---|
| Ryden Jeffrey | $101,000 | -- | |
| Federal National Mortgage Association | -- | -- | |
| Jessey John M | -- | -- | |
| Jessey John M | $128,000 | -- |
Source: Public Records
Mortgage History
| Date | Status | Borrower | Loan Amount |
|---|---|---|---|
| Open | Ryden Jeffrey | $98,439 | |
| Previous Owner | Jessey John M | $102,400 |
Source: Public Records
Tax History Compared to Growth
Tax History
| Year | Tax Paid | Tax Assessment Tax Assessment Total Assessment is a certain percentage of the fair market value that is determined by local assessors to be the total taxable value of land and additions on the property. | Land | Improvement |
|---|---|---|---|---|
| 2024 | $1,570 | $92,900 | $16,250 | $76,650 |
| 2023 | $1,584 | $67,400 | $10,125 | $57,275 |
| 2022 | $1,579 | $67,200 | $10,125 | $57,075 |
| 2021 | $1,579 | $67,200 | $10,125 | $57,075 |
| 2020 | $1,579 | $67,200 | $10,125 | $57,075 |
| 2019 | $1,579 | $67,200 | $10,125 | $57,075 |
| 2018 | $1,245 | $46,125 | $8,750 | $37,375 |
| 2017 | $1,245 | $46,125 | $8,750 | $37,375 |
| 2016 | $1,245 | $46,125 | $8,750 | $37,375 |
| 2015 | $1,158 | $39,925 | $8,750 | $31,175 |
| 2014 | $1,158 | $39,925 | $8,750 | $31,175 |
Source: Public Records
Map
Nearby Homes
- 105 Pheasant Hollow Rd
- 118 Nails Creek Dr
- 118 Ravenwood Cir
- 0 Iron Hill Rd W
- 0 Garton Rd Unit RTC2901986
- 1210 Garton Rd
- 1064 Garton Rd
- 0 Iron Hill Rd Unit RTC2942392
- 0 Iron Hill Rd Unit RTC2942390
- 0 Iron Hill Rd Unit RTC2941227
- 454 Gum Branch Rd
- 399 Edgar Meeks Rd
- 507 Whirlaway Ct
- 509 Iron Hill Rd
- 503 Whirlaway Ct
- 208 Wyburn Place
- 611 Whirlaway Dr
- 405 Barbaro Ct
- 614 Whirlaway Dr
- 1530 Roy Brown Rd
- 515 Creekstone Ct
- 115 Pheasant Hollow Rd
- 116 Pheasant Hollow Rd
- 119 Pheasant Hollow Rd
- 114 Pheasant Hollow Rd
- 124 Pheasant Hollow Rd
- 1345 Nails Creek Rd
- 513 Creekstone Ct
- 121 Pheasant Hollow Rd Unit 23
- 121 Pheasant Hollow Rd
- 111 Pheasant Hollow Rd
- 518 Creekstone Ct
- 208 Quail Ct
- 224 Quail Ct
- 1347 Nails Creek Rd
- 121 121 Pheasant Hollow Rd Lot 23
- 1333 Nails Creek Rd
- 514 Creekstone Ct
- 516 Creekstone Ct
- 110 Pheasant Hollow Rd