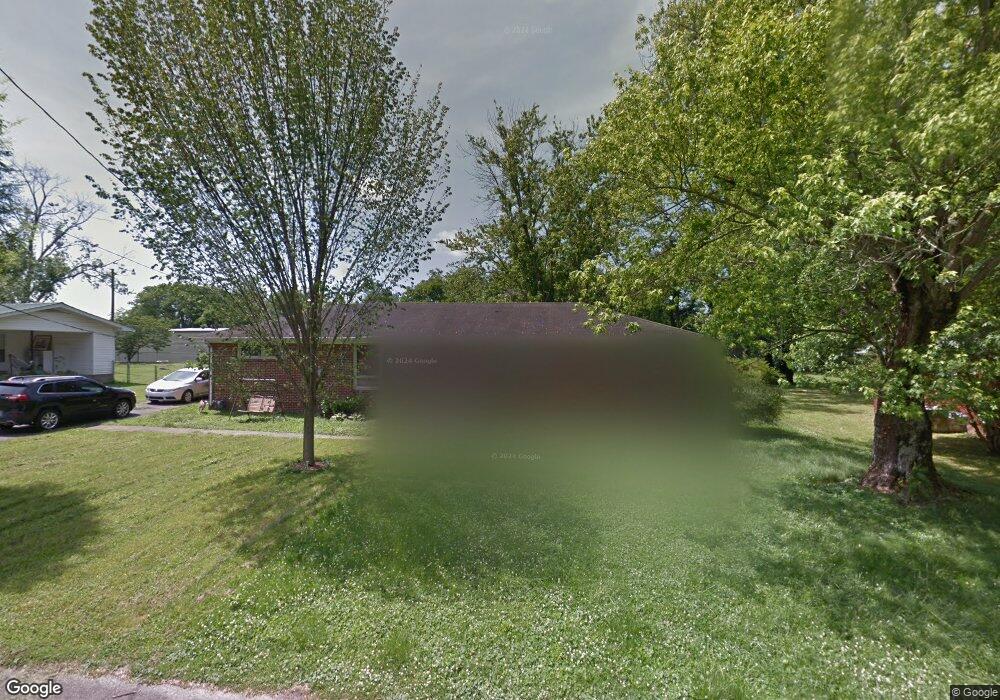
117 Pickle St Shelbyville, TN 37160
Estimated Value: $214,953 - $307,000
--
Bed
2
Baths
1,755
Sq Ft
$142/Sq Ft
Est. Value
About This Home
This home is located at 117 Pickle St, Shelbyville, TN 37160 and is currently estimated at $249,988, approximately $142 per square foot. 117 Pickle St is a home located in Bedford County with nearby schools including South Side Elementary School, Harris Middle School, and Christian Chapel Academy.
Ownership History
Date
Name
Owned For
Owner Type
Purchase Details
Closed on
Jan 13, 2021
Sold by
Haynes William Knox and Estate Of Virginia Ann Haynes
Bought by
Haynes William Knox
Current Estimated Value
Purchase Details
Closed on
Sep 30, 2010
Sold by
King Denny L
Bought by
Haynes W C
Purchase Details
Closed on
Sep 3, 2010
Sold by
Sutton Sherry D
Bought by
King Denny L
Purchase Details
Closed on
Dec 1, 1998
Bought by
Holt Fred J Rev Living Tru
Purchase Details
Closed on
Oct 8, 1987
Bought by
Holt Fred J
Purchase Details
Closed on
Apr 13, 1979
Bought by
Henslee Bertha L
Create a Home Valuation Report for This Property
The Home Valuation Report is an in-depth analysis detailing your home's value as well as a comparison with similar homes in the area
Home Values in the Area
Average Home Value in this Area
Purchase History
| Date | Buyer | Sale Price | Title Company |
|---|---|---|---|
| Haynes William Knox | -- | None Available | |
| Haynes W C | $60,000 | -- | |
| King Denny L | -- | -- | |
| Holt Fred J Rev Living Tru | -- | -- | |
| Holt Fred J | $53,800 | -- | |
| Henslee Bertha L | -- | -- |
Source: Public Records
Tax History Compared to Growth
Tax History
| Year | Tax Paid | Tax Assessment Tax Assessment Total Assessment is a certain percentage of the fair market value that is determined by local assessors to be the total taxable value of land and additions on the property. | Land | Improvement |
|---|---|---|---|---|
| 2025 | -- | $38,275 | $0 | $0 |
| 2024 | -- | $38,275 | $6,850 | $31,425 |
| 2023 | $566 | $38,275 | $6,850 | $31,425 |
| 2022 | $1,499 | $38,275 | $6,850 | $31,425 |
| 2021 | $1,361 | $38,275 | $6,850 | $31,425 |
| 2020 | $936 | $38,275 | $6,850 | $31,425 |
| 2019 | $936 | $21,125 | $3,375 | $17,750 |
| 2018 | $915 | $21,125 | $3,375 | $17,750 |
| 2017 | $915 | $21,125 | $3,375 | $17,750 |
| 2016 | $906 | $21,125 | $3,375 | $17,750 |
| 2015 | $906 | $21,125 | $3,375 | $17,750 |
| 2014 | $844 | $21,538 | $0 | $0 |
Source: Public Records
Map
Nearby Homes