


117 Renwick St Newburgh, NY 12550
Estimated payment $1,591/month
Highlights
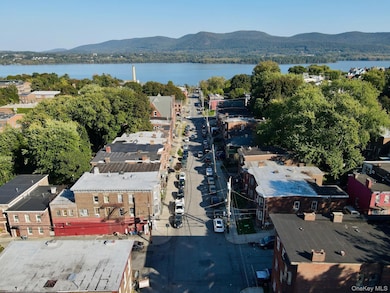
- River View
- Eat-In Kitchen
- Baseboard Heating
- Traditional Architecture
About This Home
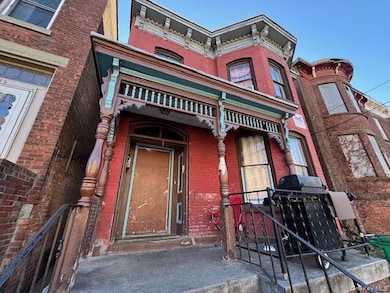
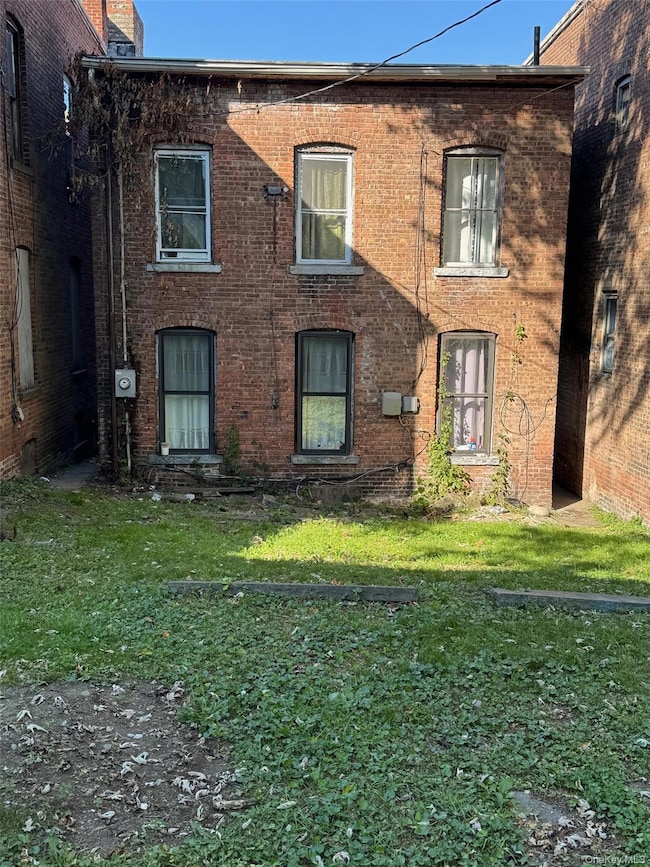
Affordable single family brick 3-bedroom detached home on two levels in City of Newburgh with small rear yard, sidewalks and all municipal services. Walking distance to George Washington Headquarters, Newburgh Brewing Company, a variety of restaurants & shops, the Newburgh waterfront & bluff overlooking the Hudson River and Mt. Beacon. House has a newer roof, and newer mechanicals. This home can also be sold as a package along with 119/121 Renwick next to each other for $700,000.
Listing Agent
RE/MAX Benchmark Realty Group Brokerage Phone: 845-565-0004 License #30KO1024277 Listed on: 10/21/2025

Home Details
Home Type
- Single Family
Est. Annual Taxes
- $6,750
Year Built
- Built in 1890 | Remodeled in 1950
Lot Details
- 2,500 Sq Ft Lot
- River Front
Parking
- On-Street Parking
Home Design
- Traditional Architecture
Interior Spaces
- 1,440 Sq Ft Home
- 2-Story Property
- River Views
- Unfinished Basement
Kitchen
- Eat-In Kitchen
- Oven
- Range
Bedrooms and Bathrooms
- 3 Bedrooms
- 1 Full Bathroom
Schools
- GAMS High Tech Magnet Elementary School
- Newburgh Middle School
- Newburgh Free Academy High School
Utilities
- No Cooling
- Baseboard Heating
- Natural Gas Connected
- Gas Water Heater
- Cable TV Available
Listing and Financial Details
- Assessor Parcel Number 331100-045-000-0006-003.000-0000
Map
Home Values in the Area
Average Home Value in this Area
Tax History
| Year | Tax Paid | Tax Assessment Tax Assessment Total Assessment is a certain percentage of the fair market value that is determined by local assessors to be the total taxable value of land and additions on the property. | Land | Improvement |
|---|---|---|---|---|
| 2024 | $6,610 | $206,000 | $23,200 | $182,800 |
| 2023 | $6,610 | $200,000 | $23,200 | $176,800 |
| 2022 | $6,619 | $154,900 | $11,200 | $143,700 |
| 2021 | $6,022 | $129,100 | $10,200 | $118,900 |
| 2020 | $3,734 | $115,300 | $10,200 | $105,100 |
| 2019 | $1,138 | $48,400 | $10,200 | $38,200 |
| 2018 | $1,138 | $48,400 | $10,900 | $37,500 |
| 2017 | $2,455 | $48,400 | $10,900 | $37,500 |
| 2016 | $4,166 | $51,300 | $10,900 | $40,400 |
| 2015 | -- | $51,300 | $10,900 | $40,400 |
| 2014 | -- | $57,000 | $10,900 | $46,100 |
Property History
| Date | Event | Price | List to Sale | Price per Sq Ft |
|---|---|---|---|---|
| 10/21/2025 10/21/25 | For Sale | $200,000 | -- | $139 / Sq Ft |
Purchase History
| Date | Type | Sale Price | Title Company |
|---|---|---|---|
| Deed | $4,000 | -- | |
| Deed | $4,000 | -- | |
| Deed | $95,000 | Lou Spizzirro | |
| Bargain Sale Deed | $13,000 | Washington Title Insurance C | |
| Deed | $1,000 | -- |
Source: OneKey® MLS
MLS Number: 924181
APN: 331100-045-000-0006-003.000-0000
Disclaimer: Certain information contained herein is derived from information provided by parties other than Homes.com. All information provided is deemed reliable, but is not guaranteed to be accurate and should be independently verified.
![]() The data relating to real estate for sale or lease on this web site comes in part from OneKey® MLS. Real estate listings held by brokerage firms other than Ten-X are marked with the OneKey® MLS logo or an abbreviated logo and detailed information about them includes the name of the listing broker.
The data relating to real estate for sale or lease on this web site comes in part from OneKey® MLS. Real estate listings held by brokerage firms other than Ten-X are marked with the OneKey® MLS logo or an abbreviated logo and detailed information about them includes the name of the listing broker.
Based on information submitted to the MLS GRID. All data is obtained from various sources and may not have been verified by broker or MLS GRID. Supplied Open House Information is subject to change without notice. All information should be independently reviewed and verified for accuracy. Properties may or may not be listed by the office/agent presenting the information. Some IDX listings have been excluded from this website. IDX information is provided exclusively for personal, non-commercial use, and may not be used for any purpose other than to identify prospective properties consumers may be interested in purchasing.
Information is deemed reliable but not guaranteed.
Copyright 2026 OneKey® MLS. All rights reserved.
Based on information submitted to the MLS GRID
- 119 Renwick St
- 121 Renwick St
- 193 Renwick St
- 102 Renwick St
- 13 Liberty Street Washington Heights
- 145 Renwick St
- 91 Carson Ave
- 30 Benkard Ave
- 105 Carson Ave
- 12 Liberty St
- 99 Overlook Place
- 66 Benkard Ave
- 36 Liberty St
- 115 William St
- 52 Beacon St
- 128 William St
- 78 Liberty St
- 107 Benkard Ave
- 70 Johnes St Unit 325E
- 70 Johnes St Unit 328
- 61 Carson Ave
- 2 Liberty St
- 44 Benkard Ave Unit 44 Benkard 2nd Floor
- 46 Benkard Ave Unit 1
- 2 Courtney Ave
- 95 Liberty St Unit 1
- 60 Bay View Terrace
- 97 Liberty St Unit 3S
- 87 Broadway Unit 2
- 177 W Parmenter St Unit 1
- 167 Liberty St
- 23 Dubois St Unit 4
- 175 Liberty St Unit 2
- 197 Liberty St Unit 1
- 112 1st St Unit 3
- 57 Carpenter Ave
- 140 3rd St Unit 2
- 220 Walsh Ave Unit 2
- 182 Grand St
- 44 Cedar Ave Unit 2
Ask me questions while you tour the home.