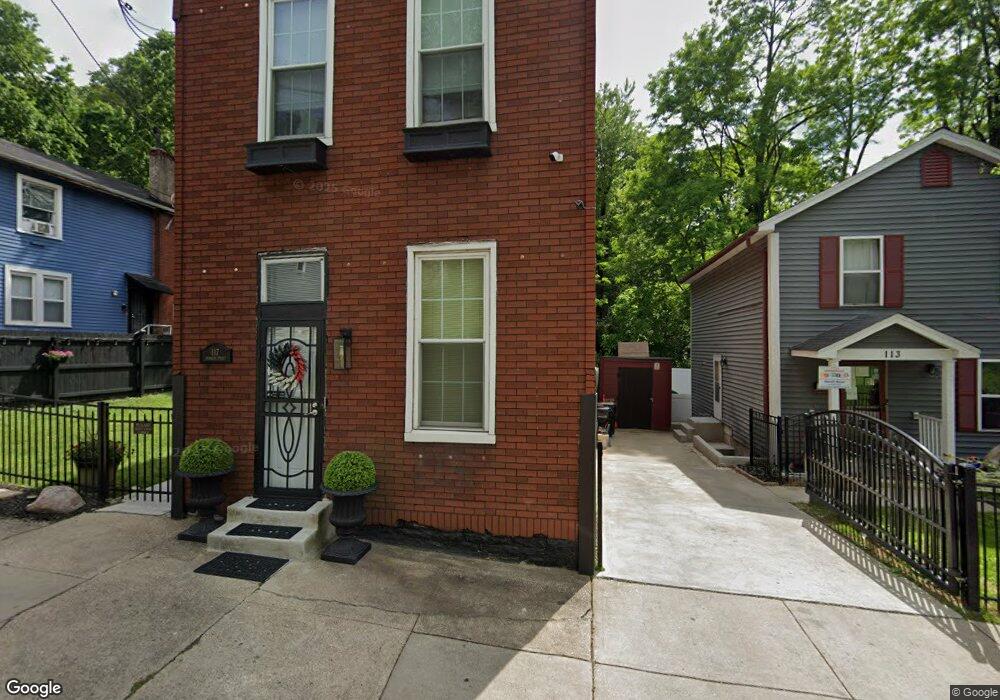
117 Winkler St Cincinnati, OH 45219
Mount Auburn NeighborhoodEstimated Value: $166,244 - $342,000
2
Beds
2
Baths
1,696
Sq Ft
$148/Sq Ft
Est. Value
About This Home
This home is located at 117 Winkler St, Cincinnati, OH 45219 and is currently estimated at $250,811, approximately $147 per square foot. 117 Winkler St is a home located in Hamilton County with nearby schools including Rothenberg Preparatory Academy, Robert A. Taft Information Technology High School, and Gilbert A. Dater High School.
Ownership History
Date
Name
Owned For
Owner Type
Purchase Details
Closed on
Nov 30, 2000
Sold by
Mbi Group
Bought by
Davis Lenise
Current Estimated Value
Home Financials for this Owner
Home Financials are based on the most recent Mortgage that was taken out on this home.
Original Mortgage
$52,000
Outstanding Balance
$22,003
Interest Rate
10.62%
Estimated Equity
$228,808
Create a Home Valuation Report for This Property
The Home Valuation Report is an in-depth analysis detailing your home's value as well as a comparison with similar homes in the area
Home Values in the Area
Average Home Value in this Area
Purchase History
| Date | Buyer | Sale Price | Title Company |
|---|---|---|---|
| Davis Lenise | $65,000 | Performance Title Agency Inc |
Source: Public Records
Mortgage History
| Date | Status | Borrower | Loan Amount |
|---|---|---|---|
| Open | Davis Lenise | $52,000 | |
| Closed | Davis Lenise | $6,500 |
Source: Public Records
Tax History
| Year | Tax Paid | Tax Assessment Tax Assessment Total Assessment is a certain percentage of the fair market value that is determined by local assessors to be the total taxable value of land and additions on the property. | Land | Improvement |
|---|---|---|---|---|
| 2025 | $1,903 | $30,863 | $5,243 | $25,620 |
| 2024 | $1,845 | $30,863 | $5,243 | $25,620 |
| 2023 | $1,887 | $30,863 | $5,243 | $25,620 |
| 2022 | $781 | $11,403 | $1,491 | $9,912 |
| 2021 | $750 | $11,403 | $1,491 | $9,912 |
| 2020 | $772 | $11,403 | $1,491 | $9,912 |
| 2019 | $741 | $10,003 | $1,309 | $8,694 |
| 2018 | $742 | $10,003 | $1,309 | $8,694 |
| 2017 | $704 | $10,003 | $1,309 | $8,694 |
| 2016 | $728 | $10,196 | $1,173 | $9,023 |
| 2015 | $656 | $10,196 | $1,173 | $9,023 |
| 2014 | $661 | $10,196 | $1,173 | $9,023 |
| 2013 | $617 | $9,353 | $1,075 | $8,278 |
Source: Public Records
Map
Nearby Homes
- 113 Winkler St
- 121 Winkler St
- 111 Winkler St
- 109 Winkler St
- 118 Winkler St
- 125 Winkler St
- 114 Winkler St
- 116 Winkler St
- 105 Winkler St
- 62 Mcgrew St
- 2160 Rice St
- 120 Winkler St
- 122 Winkler St
- 131 Winkler St
- 108 Winkler St
- 101 Winkler St
- 124 Winkler St
- 124 Winkler St Unit 1
- 126 Winkler St
- 2152 Rice St
Your Personal Tour Guide
Ask me questions while you tour the home.