Estimated Value: $692,215 - $883,000
3
Beds
2
Baths
1,139
Sq Ft
$712/Sq Ft
Est. Value
About This Home
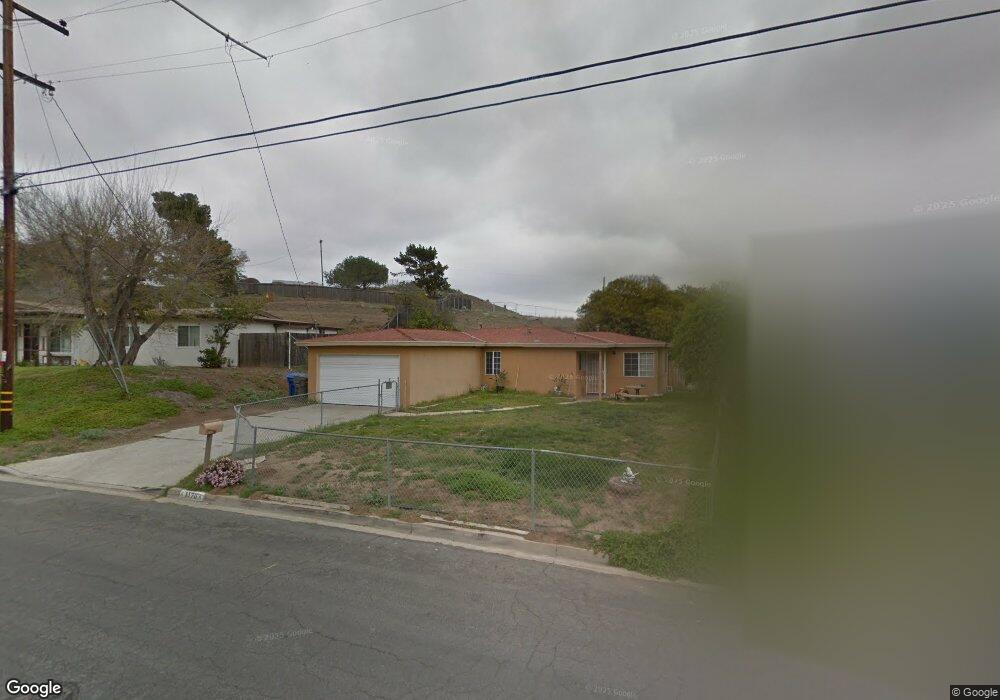
This home is located at 1170 Hackamore Rd, Vista, CA 92083 and is currently estimated at $810,804, approximately $711 per square foot. 1170 Hackamore Rd is a home located in San Diego County with nearby schools including Grapevine Elementary School, Madison Middle School, and Rancho Buena Vista High School.
Ownership History
Date
Name
Owned For
Owner Type
Purchase Details
Closed on
Sep 11, 2018
Sold by
Martinez Roberto T
Bought by
Martinez Roberto T and Roberto T Martinez Trust
Current Estimated Value
Purchase Details
Closed on
Feb 28, 2012
Sold by
Martinez Roberto T
Bought by
Martinez Roberto T
Home Financials for this Owner
Home Financials are based on the most recent Mortgage that was taken out on this home.
Original Mortgage
$100,000
Outstanding Balance
$68,562
Interest Rate
3.83%
Mortgage Type
New Conventional
Estimated Equity
$742,242
Purchase Details
Closed on
May 16, 2008
Sold by
Martinez Roberto T
Bought by
Martinez Roberto T
Purchase Details
Closed on
Nov 2, 2004
Sold by
Martinez Robert T
Bought by
Martinez Roberto T
Purchase Details
Closed on
Jun 26, 1985
Create a Home Valuation Report for This Property
The Home Valuation Report is an in-depth analysis detailing your home's value as well as a comparison with similar homes in the area
Home Values in the Area
Average Home Value in this Area
Purchase History
| Date | Buyer | Sale Price | Title Company |
|---|---|---|---|
| Martinez Roberto T | -- | None Available | |
| Martinez Roberto T | -- | First American Title San Die | |
| Martinez Roberto T | -- | None Available | |
| Martinez Roberto T | -- | -- | |
| Martinez Robert T | -- | -- | |
| -- | $87,100 | -- |
Source: Public Records
Mortgage History
| Date | Status | Borrower | Loan Amount |
|---|---|---|---|
| Open | Martinez Roberto T | $100,000 |
Source: Public Records
Tax History
| Year | Tax Paid | Tax Assessment Tax Assessment Total Assessment is a certain percentage of the fair market value that is determined by local assessors to be the total taxable value of land and additions on the property. | Land | Improvement |
|---|---|---|---|---|
| 2025 | $2,659 | $176,868 | $60,454 | $116,414 |
| 2024 | $2,659 | $173,401 | $59,269 | $114,132 |
| 2023 | $2,612 | $170,002 | $58,107 | $111,895 |
| 2022 | $2,607 | $166,669 | $56,968 | $109,701 |
| 2021 | $2,552 | $163,401 | $55,851 | $107,550 |
| 2020 | $2,532 | $161,727 | $55,279 | $106,448 |
| 2019 | $2,499 | $158,557 | $54,196 | $104,361 |
| 2018 | $2,411 | $155,449 | $53,134 | $102,315 |
| 2017 | $2,379 | $152,402 | $52,093 | $100,309 |
| 2016 | $2,326 | $149,415 | $51,072 | $98,343 |
| 2015 | $2,309 | $147,171 | $50,305 | $96,866 |
| 2014 | $2,258 | $144,289 | $49,320 | $94,969 |
Source: Public Records
Map
Nearby Homes
- 323 Hill Dr
- 607 Via Del Mar
- 801 W Vista Way
- 611 Via Santa Paulo
- 1555 Acacia Cir Unit 1
- 230 Diamond Way Unit 147
- 1050 La Tortuga Dr Unit 15
- 629 Via Santiago
- 634 Via Santa Cruz
- 730 Silver Dr
- 802 Bonita Dr
- 647 Via Costa Rica
- 1192 Via Santa Paulo
- 750 Breeze Hill Rd Unit 100
- 810 Anns Way
- 595 Copper Dr
- 400 N Melrose Dr Unit 18
- 601 Marazon Ln
- 325 N Melrose Dr Unit A
- 313 N Melrose Dr Unit C
- 1162 Hackamore Rd
- 1178 Hackamore Rd
- 1186 Hackamore Rd
- 1154 Hackamore Rd
- 1175 Hackamore Rd
- 1159 Hackamore Rd
- 1146 Hackamore Rd
- 212 Colusa Way
- 101 Santa Clara Dr
- 1138 Hackamore Rd
- 126 Santa Clara Dr
- 1151 Hackamore Rd
- 220 Colusa Way
- 133 Santa Clara Dr
- 1130 Hackamore Rd
- 135 Santa Clara Dr
- 1122 Hackamore Rd
- 228 Colusa Way
- 233 Colusa Way
- 130 Santa Clara Dr
Your Personal Tour Guide
Ask me questions while you tour the home.