
Landlord's Agent in 2018
Elaine VonCannon
Coldwell Banker Traditions
(757) 288-4685
5 in this area
53 Total Sales
Estimated Value: $480,991 - $516,000
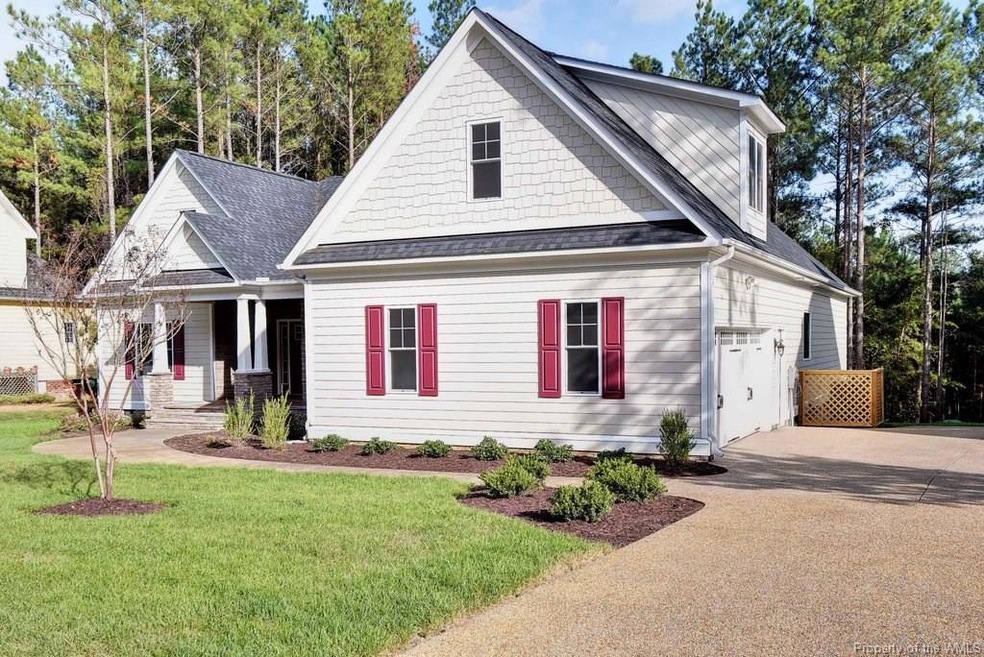
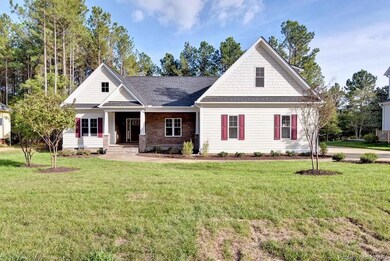
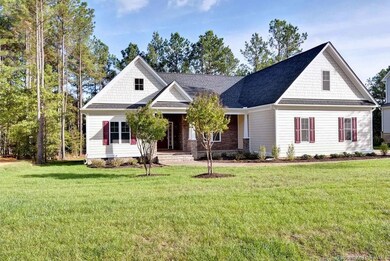
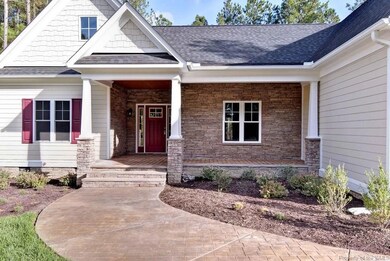
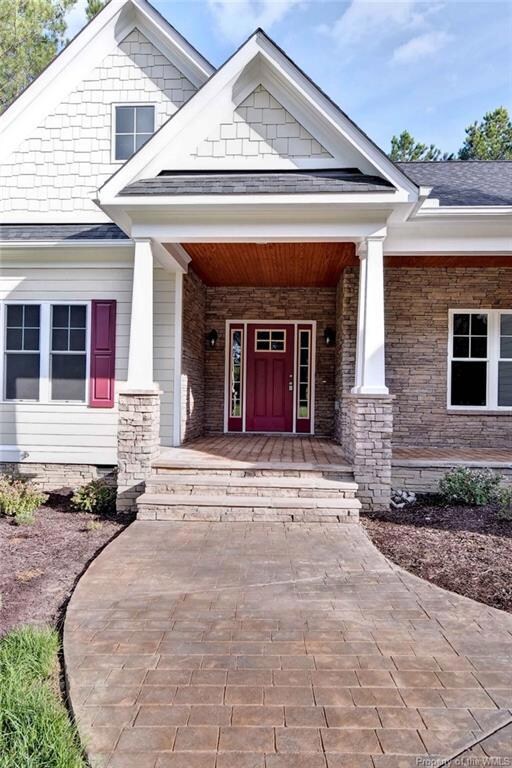
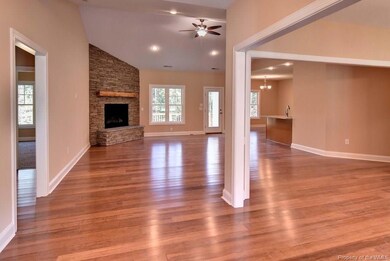
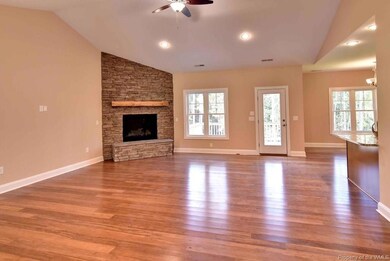
Welcome to New Kent County & to your dream home in the golf community at Brickshire! Lovely transitional rancher w/ 2700 sq ft. open floor plan that features 4 bedrooms & 3 full baths. Granite countertops in eat in kitchen that features an island, wood, tile, carpet flooring, all on 1 level with Huge bonus room 17’7 x19’6 w/ gas burning fireplace. Located half way between Williamsburg and Richmond. You will feel like you are on vacation every day! Easy access to interstate & conveniently located between Richmond & Williamsburg for the best of both without the high prices and congestion! Available April 1. No smoking, No pets.
Last Agent to Rent the Property
Coldwell Banker Traditions License #0225053665 Listed on: 01/31/2018
Last Renter's Agent
Coldwell Banker Traditions License #0225053665 Listed on: 01/31/2018
| Date | Buyer | Sale Price | Title Company |
|---|---|---|---|
| Blackwell Eric | $30,000 | -- |
| Date | Event | Price | List to Sale | Price per Sq Ft | Prior Sale |
|---|---|---|---|---|---|
| 04/01/2018 04/01/18 | Rented | $1,825 | 0.0% | -- | |
| 01/31/2018 01/31/18 | For Rent | $1,825 | 0.0% | -- | |
| 03/15/2013 03/15/13 | Sold | $30,000 | -33.2% | $11 / Sq Ft | View Prior Sale |
| 02/25/2013 02/25/13 | Pending | -- | -- | -- | |
| 03/01/2012 03/01/12 | For Sale | $44,900 | -- | $17 / Sq Ft |
| Year | Tax Paid | Tax Assessment Tax Assessment Total Assessment is a certain percentage of the fair market value that is determined by local assessors to be the total taxable value of land and additions on the property. | Land | Improvement |
|---|---|---|---|---|
| 2025 | $2,353 | $392,200 | $91,800 | $300,400 |
| 2024 | $2,314 | $392,200 | $91,800 | $300,400 |
| 2023 | $2,298 | $343,000 | $46,100 | $296,900 |
| 2022 | $230 | $343,000 | $46,100 | $296,900 |
| 2021 | $2,635 | $333,500 | $31,500 | $302,000 |
| 2020 | $2,635 | $333,500 | $31,500 | $302,000 |
| 2019 | $273 | $333,000 | $34,300 | $298,700 |
| 2018 | $273 | $333,000 | $34,300 | $298,700 |
| 2017 | $2,619 | $315,600 | $32,000 | $283,600 |
| 2016 | $2,619 | $315,600 | $32,000 | $283,600 |
| 2015 | $504 | $60,000 | $60,000 | $0 |
| 2014 | -- | $60,000 | $60,000 | $0 |
Landlord's Agent in 2018
Elaine VonCannon
Coldwell Banker Traditions
(757) 288-4685
5 in this area
53 Total Sales
M
Seller's Agent in 2013
Maggie Maffei
Long & Foster
Source: Williamsburg Multiple Listing Service
MLS Number: 1803238
APN: 33B13 32M 58
Disclaimer: Certain information contained herein is derived from information provided by parties other than Homes.com. All information provided is deemed reliable, but is not guaranteed to be accurate and should be independently verified.
![]() IDX information is provided exclusively for personal, non-commercial use, and may not be used for any purpose other than to identify prospective properties consumers may be interested in purchasing. Information is deemed reliable but not guaranteed.
IDX information is provided exclusively for personal, non-commercial use, and may not be used for any purpose other than to identify prospective properties consumers may be interested in purchasing. Information is deemed reliable but not guaranteed.