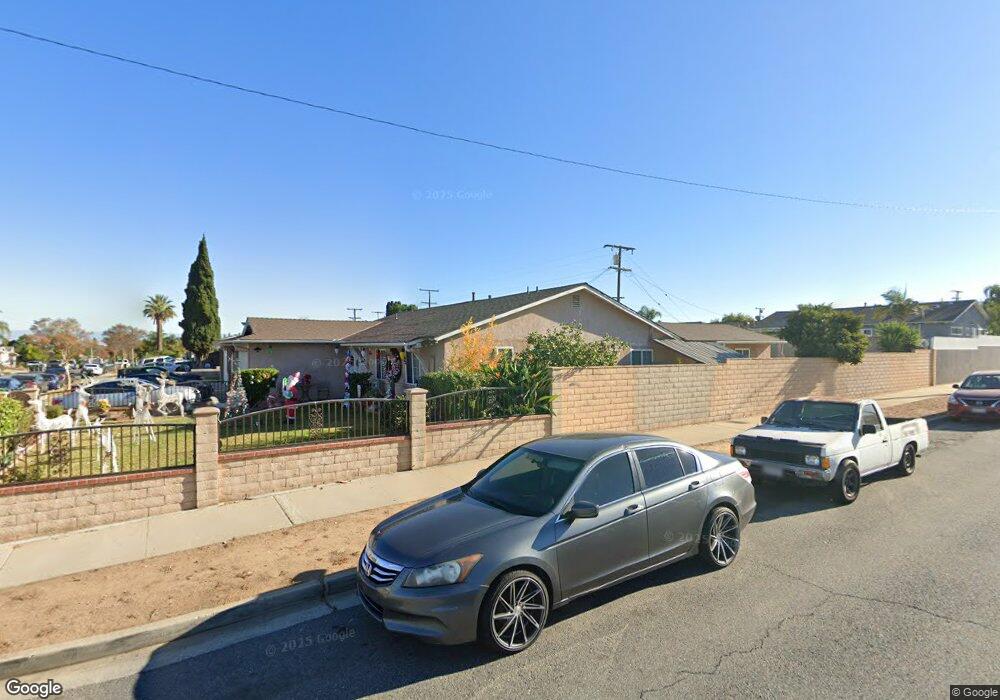
1171 Sapphire Ln Corona, CA 92882
Central Corona NeighborhoodEstimated Value: $642,000 - $844,000
6
Beds
2
Baths
1,824
Sq Ft
$401/Sq Ft
Est. Value
About This Home
This home is located at 1171 Sapphire Ln, Corona, CA 92882 and is currently estimated at $730,710, approximately $400 per square foot. 1171 Sapphire Ln is a home located in Riverside County with nearby schools including Coronita Elementary School, Letha Raney Intermediate School, and Corona High School.
Ownership History
Date
Name
Owned For
Owner Type
Purchase Details
Closed on
Oct 7, 2005
Sold by
Barron Francisco L and Barron Mireya A
Bought by
Barron Francisco L and Barron Mireya A
Current Estimated Value
Home Financials for this Owner
Home Financials are based on the most recent Mortgage that was taken out on this home.
Original Mortgage
$219,000
Outstanding Balance
$1,515
Interest Rate
5.63%
Mortgage Type
Stand Alone Refi Refinance Of Original Loan
Estimated Equity
$729,195
Purchase Details
Closed on
May 15, 1996
Sold by
Sec Hud
Bought by
Barron Francisco L and Barron Mireya A
Home Financials for this Owner
Home Financials are based on the most recent Mortgage that was taken out on this home.
Original Mortgage
$103,068
Interest Rate
8.09%
Mortgage Type
FHA
Purchase Details
Closed on
Jan 20, 1995
Sold by
Greystone Servicing Corp
Bought by
Hud
Purchase Details
Closed on
Jan 19, 1995
Sold by
Ramirez Michael T and Ramirez Irene
Bought by
Greystone Servicing Corp
Create a Home Valuation Report for This Property
The Home Valuation Report is an in-depth analysis detailing your home's value as well as a comparison with similar homes in the area
Home Values in the Area
Average Home Value in this Area
Purchase History
| Date | Buyer | Sale Price | Title Company |
|---|---|---|---|
| Barron Francisco L | -- | Orange Coast Title Co | |
| Barron Francisco L | $105,000 | First Southwestern Title Co | |
| Hud | -- | First Southwestern Title Co | |
| Greystone Servicing Corp | $146,505 | First Southwestern Title Co |
Source: Public Records
Mortgage History
| Date | Status | Borrower | Loan Amount |
|---|---|---|---|
| Open | Barron Francisco L | $219,000 | |
| Closed | Barron Francisco L | $103,068 |
Source: Public Records
Tax History Compared to Growth
Tax History
| Year | Tax Paid | Tax Assessment Tax Assessment Total Assessment is a certain percentage of the fair market value that is determined by local assessors to be the total taxable value of land and additions on the property. | Land | Improvement |
|---|---|---|---|---|
| 2025 | $2,232 | $199,306 | $74,734 | $124,572 |
| 2023 | $2,232 | $191,569 | $71,833 | $119,736 |
| 2022 | $2,162 | $187,814 | $70,425 | $117,389 |
| 2021 | $2,119 | $184,133 | $69,045 | $115,088 |
| 2020 | $2,096 | $182,246 | $68,338 | $113,908 |
| 2019 | $2,049 | $178,674 | $66,999 | $111,675 |
| 2018 | $2,004 | $175,172 | $65,686 | $109,486 |
| 2017 | $1,956 | $171,739 | $64,399 | $107,340 |
| 2016 | $1,937 | $168,373 | $63,137 | $105,236 |
| 2015 | $1,895 | $165,846 | $62,190 | $103,656 |
| 2014 | $1,828 | $162,600 | $60,973 | $101,627 |
Source: Public Records
Map
Nearby Homes
- 1717 Via Del Rio
- 1733 Bern Dr
- 1533 Camelot Dr
- 1514 Via Del Rio
- 1351 Kirkwood Dr
- 1505 Camelot Dr
- 1558 Camelot Dr
- 860 Encino Place
- 1871 Dawn Ridge Dr
- 1463 Moore Cir
- 1361 Camelot Dr
- 1924 Via Del Rio
- 1382 Via Santiago
- 1410 Rainbrook Way
- 1313 Via Santiago Unit A
- 1317 Via Santiago
- 1194 Border Ave Unit A
- 1396 Thornwood Square
- 1167 Hummingbird Ln
- 1535 Border Ave Unit C
- 1163 Sapphire Ln
- 1190 Aquamarine Ln
- 1151 Sapphire Ln
- 1180 Aquamarine Ln
- 1670 Beryl Ln
- 1662 Beryl Ln
- 1678 Beryl Ln
- 1170 Aquamarine Ln
- 1150 Sapphire Ln
- 1139 Sapphire Ln
- 1140 Sapphire Ln
- 1654 Beryl Ln
- 1686 Beryl Ln
- 1120 Sapphire Ln
- 1160 Aquamarine Ln
- 1646 Beryl Ln
- 1125 Sapphire Ln
- 1694 Beryl Ln
- 1110 Sapphire Ln
- 1150 Aquamarine Ln