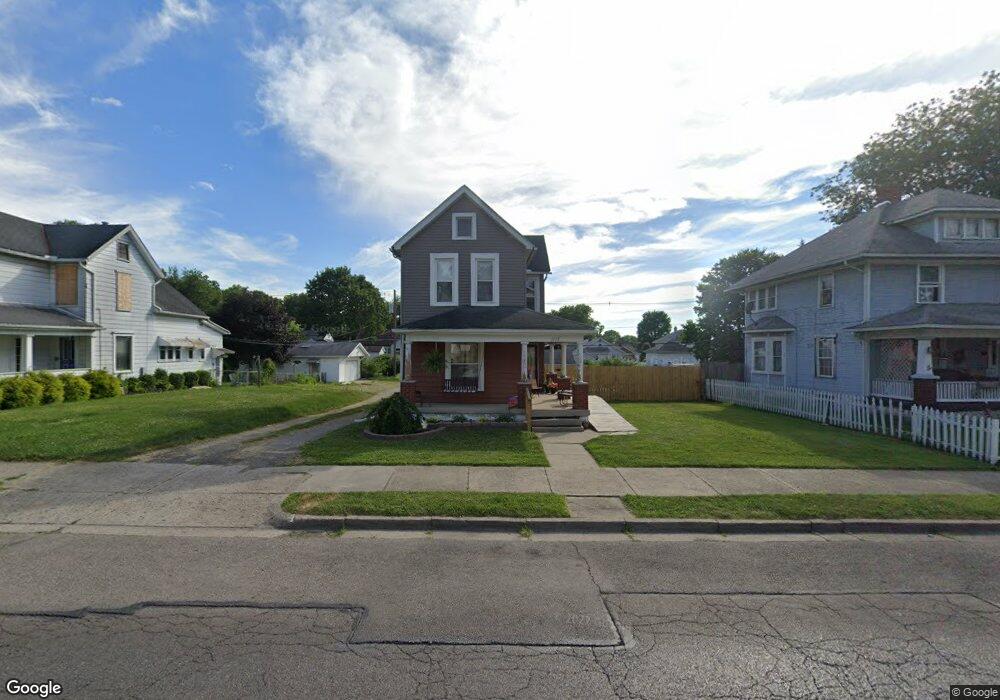
1173 Selma Rd Springfield, OH 45505
Estimated Value: $77,000 - $135,000
2
Beds
2
Baths
1,305
Sq Ft
$78/Sq Ft
Est. Value
About This Home
This home is located at 1173 Selma Rd, Springfield, OH 45505 and is currently estimated at $102,147, approximately $78 per square foot. 1173 Selma Rd is a home located in Clark County with nearby schools including Kenwood Elementary School, Hayward Middle School, and Springfield High School.
Ownership History
Date
Name
Owned For
Owner Type
Purchase Details
Closed on
Sep 17, 2021
Sold by
Lay Vanessa F
Bought by
Lay Vanessa F and Taylor Mary Evelyn
Current Estimated Value
Home Financials for this Owner
Home Financials are based on the most recent Mortgage that was taken out on this home.
Original Mortgage
$55,344
Outstanding Balance
$41,389
Interest Rate
2.1%
Mortgage Type
FHA
Estimated Equity
$60,758
Purchase Details
Closed on
Jun 9, 1997
Sold by
Taylor Mary E
Bought by
Lay Vanessa F
Home Financials for this Owner
Home Financials are based on the most recent Mortgage that was taken out on this home.
Original Mortgage
$34,304
Interest Rate
8.17%
Mortgage Type
FHA
Purchase Details
Closed on
Apr 14, 1995
Sold by
Bowen Jerry R
Bought by
Taylor Jimmy L and Taylor Mary
Home Financials for this Owner
Home Financials are based on the most recent Mortgage that was taken out on this home.
Original Mortgage
$32,300
Interest Rate
8.55%
Mortgage Type
New Conventional
Create a Home Valuation Report for This Property
The Home Valuation Report is an in-depth analysis detailing your home's value as well as a comparison with similar homes in the area
Home Values in the Area
Average Home Value in this Area
Purchase History
| Date | Buyer | Sale Price | Title Company |
|---|---|---|---|
| Lay Vanessa F | -- | Wave Title Agency Inc | |
| Lay Vanessa F | -- | Wave Title | |
| Lay Vanessa F | $34,000 | -- | |
| Taylor Jimmy L | $34,000 | -- |
Source: Public Records
Mortgage History
| Date | Status | Borrower | Loan Amount |
|---|---|---|---|
| Open | Lay Vanessa F | $55,344 | |
| Closed | Lay Vanessa F | $55,344 | |
| Previous Owner | Lay Vanessa F | $34,304 | |
| Previous Owner | Taylor Jimmy L | $32,300 |
Source: Public Records
Tax History
| Year | Tax Paid | Tax Assessment Tax Assessment Total Assessment is a certain percentage of the fair market value that is determined by local assessors to be the total taxable value of land and additions on the property. | Land | Improvement |
|---|---|---|---|---|
| 2025 | $534 | $30,870 | $3,260 | $27,610 |
| 2024 | $551 | $20,600 | $2,570 | $18,030 |
| 2023 | $551 | $20,600 | $2,570 | $18,030 |
| 2022 | $1,017 | $20,600 | $2,570 | $18,030 |
| 2021 | $1,005 | $18,800 | $2,330 | $16,470 |
| 2020 | $1,007 | $18,800 | $2,330 | $16,470 |
| 2019 | $1,010 | $18,800 | $2,330 | $16,470 |
| 2018 | $894 | $15,990 | $1,940 | $14,050 |
| 2017 | $894 | $15,989 | $1,943 | $14,046 |
| 2016 | $895 | $15,989 | $1,943 | $14,046 |
| 2015 | $1,414 | $15,989 | $1,943 | $14,046 |
| 2014 | $908 | $15,989 | $1,943 | $14,046 |
| 2013 | $1,393 | $15,989 | $1,943 | $14,046 |
Source: Public Records
Map
Nearby Homes
- 1111 Lafayette Ave
- 1247 Selma Rd
- 908 Pine St
- 1213 Gable St
- 652 E Southern Ave
- 1318 Maryland Ave
- 1440 Selma Rd
- 1008 Tibbetts Ave
- 550 E Rose St
- 453 E Pleasant St
- 1519 Tibbetts Ave
- 441 E Euclid Ave
- 705 York St
- 1225 Beacon St
- 625 Tibbetts Ave
- 1652 Kenton St
- 1724 Clay St
- 1714 Kenton St
- 1823 Rutland Ave
- 1846 Ohio Ave
- 1163 Selma Rd
- 1177 Selma Rd
- 1155 Selma Rd Unit 1157
- 1209 Selma Rd
- 1172 Delta Rd
- 1168 Delta Rd
- 1176 Delta Rd
- 1164 Delta Rd
- 1186 Delta Rd
- 1166 Selma Rd
- 1215 Selma Rd
- 1164 Selma Rd
- 1158 Delta Rd
- 1160 Selma Rd
- 1190 Delta Rd
- 1115 Selma Rd
- 1156 Selma Rd
- 1204 Selma Rd Unit 1206
- 1194 Delta Rd
- 1010 E Southern Ave
Your Personal Tour Guide
Ask me questions while you tour the home.