Estimated Value: $800,000 - $885,262
About This Home
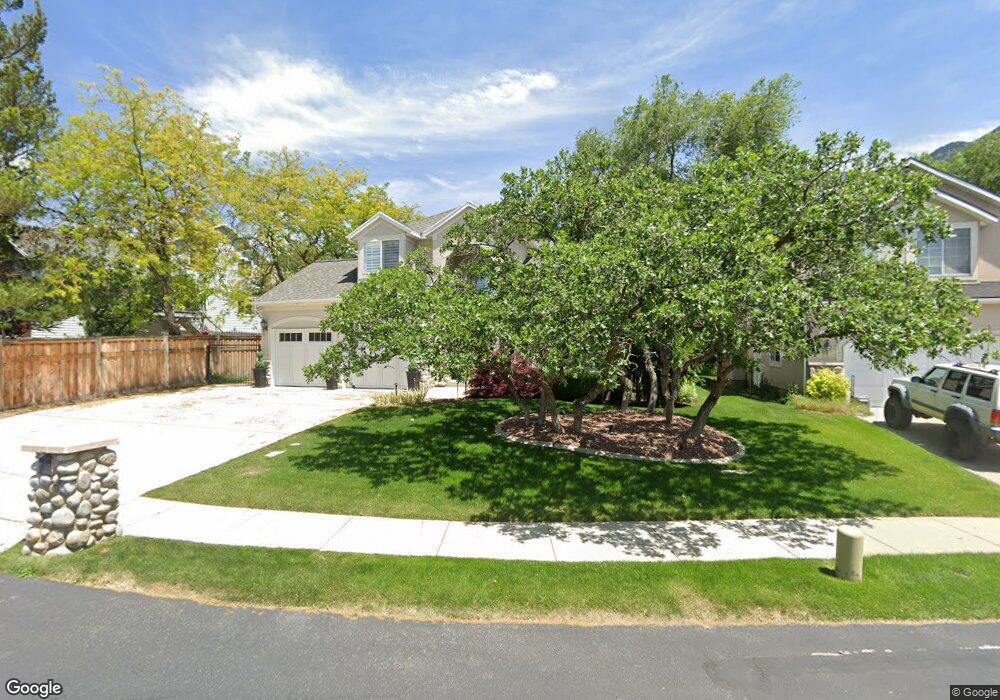
This home is located at 11733 Oak Manor Dr, Sandy, UT 84092 and is currently estimated at $854,316, approximately $436 per square foot. 11733 Oak Manor Dr is a home located in Salt Lake County with nearby schools including Bell Canyon Montessori School and Gateway Academy.
Ownership History
We collect this data history from publicly available records. To have your information removed, we recommend requesting removal directly through your county’s website.
Purchase Details
Home Financials for this Owner
Home Financials are based on the most recent Mortgage that was taken out on this home.Purchase Details
Home Financials for this Owner
Home Financials are based on the most recent Mortgage that was taken out on this home.Purchase Details
Home Financials for this Owner
Home Financials are based on the most recent Mortgage that was taken out on this home.Purchase Details
Purchase Details
Purchase Details
Home Financials for this Owner
Home Financials are based on the most recent Mortgage that was taken out on this home.Purchase Details
Purchase Details
Home Financials for this Owner
Home Financials are based on the most recent Mortgage that was taken out on this home.Purchase Details
Home Financials for this Owner
Home Financials are based on the most recent Mortgage that was taken out on this home.Purchase Details
Home Values in the Area
Average Home Value in this Area
Purchase History
We collect this data history from publicly available records. To have your information removed, we recommend requesting removal directly through your county’s website.
| Date | Buyer | Sale Price | Title Company |
|---|---|---|---|
| -- | Gateway Title Ins Agcy Llc | ||
| -- | Landmark Title | ||
| -- | Landmark Title | ||
| -- | None Available | ||
| -- | -- | ||
| -- | First American Title | ||
| -- | -- | ||
| -- | -- | ||
| -- | First American Title Insuran | ||
| -- | -- |
Mortgage History
We collect this data history from publicly available records. To have your information removed, we recommend requesting removal directly through your county’s website.
| Date | Status | Borrower | Loan Amount |
|---|---|---|---|
| Open | $313,700 | ||
| Previous Owner | $61,500 | ||
| Previous Owner | $328,000 | ||
| Previous Owner | $328,000 | ||
| Previous Owner | $47,000 | ||
| Previous Owner | $45,000 | ||
| Closed | $80,000 |
Tax History
We collect this data history from publicly available records. To have your information removed, we recommend requesting removal directly through your county’s website.
| Year | Tax Paid | Tax Assessment Tax Assessment Total Assessment is a certain percentage of the fair market value that is determined by local assessors to be the total taxable value of land and additions on the property. | Land | Improvement |
|---|---|---|---|---|
| 2025 | $4,222 | $811,600 | $261,300 | $550,300 |
| 2024 | $4,063 | $768,200 | $251,500 | $516,700 |
| 2023 | $3,931 | $742,600 | $241,900 | $500,700 |
| 2022 | $4,051 | $748,300 | $237,100 | $511,200 |
| 2021 | $3,503 | $550,900 | $184,400 | $366,500 |
| 2020 | $3,165 | $470,100 | $184,400 | $285,700 |
| 2019 | $3,033 | $439,600 | $174,000 | $265,600 |
| 2018 | $2,819 | $427,400 | $174,000 | $253,400 |
| 2017 | $2,936 | $426,000 | $174,000 | $252,000 |
| 2016 | $2,858 | $401,300 | $160,400 | $240,900 |
| 2015 | $2,989 | $389,000 | $175,300 | $213,700 |
| 2014 | $2,990 | $382,300 | $175,300 | $207,000 |
Map
- 11689 S Oak Manor Dr
- 2148 E Pinecrest Ln
- 11724 Briarglen Dr
- 1726 E Wasatch Blvd
- 2192 E High Mesa Dr
- 11789 S Nicklaus Rd
- 11382 S Canyon Falls Ln
- 2092 E 11270 S
- 12056 S Cortina Crest Dr
- 1956 Brandon Park Place
- 12166 S Fairway Cir
- 11446 S 2320 E
- 11902 S Autumn Ridge Dr
- 1935 Brandon Park Place
- 2373 E Bear Hills Cir
- 11462 S Hidden Valley Blvd
- 11943 S Autumn Ridge Dr
- 1653 Crescent View Dr
- 12298 S Graystone Ct
- 11538 High Mountain Dr
- 11733 S Oak Manor Dr
- 11741 Oak Manor Dr
- 1976 E Harmony Grove Way
- 1976 Harmony Grove Way
- 1982 E Harmony Grove Way
- 1982 Harmony Grove Way
- 11751 Oak Manor Dr
- 11751 S Oak Manor Dr
- 1957 E Quail Crossing Ln
- 1957 Quail Crossing Ln
- 1989 E Village Oak Ln
- 1989 Village Oak Ln
- 1988 Harmony Grove Way
- 11722 S Oak Manor Dr
- 11756 Oak Manor Dr
- 11759 Oak Manor Dr
- 11759 S Oak Manor Dr
- 1949 E Quail Crossing Ln
- 1949 Quail Crossing Ln
- 1990 Village Oak Ln
Ask me questions while you tour the home.