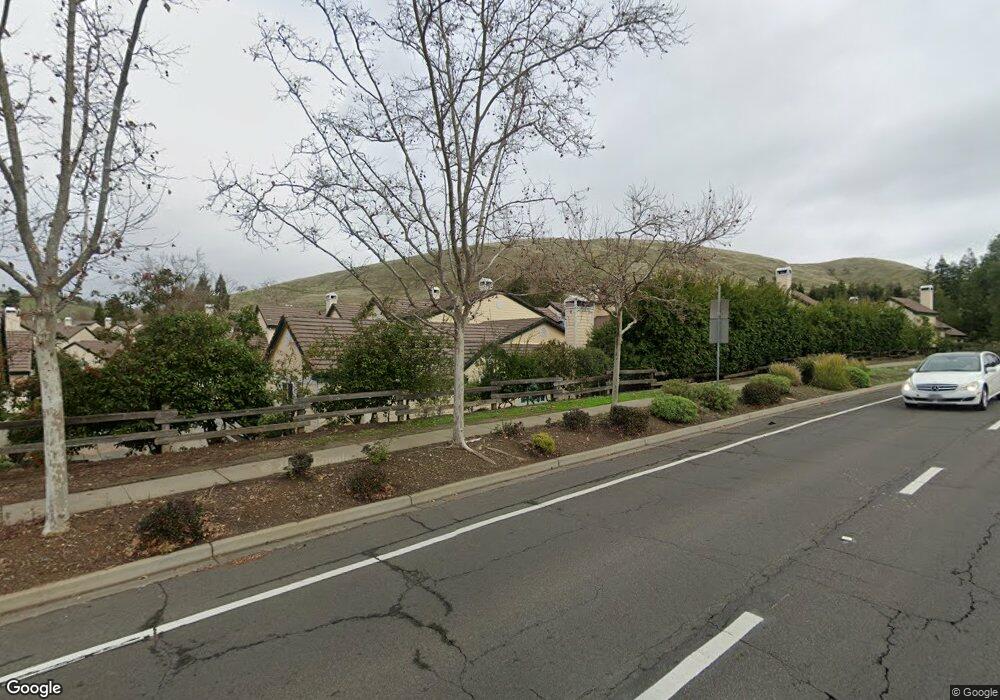
1175 Shell Ln Clayton, CA 94517
Estimated Value: $587,788 - $679,000
2
Beds
2
Baths
1,145
Sq Ft
$551/Sq Ft
Est. Value
About This Home
This home is located at 1175 Shell Ln, Clayton, CA 94517 and is currently estimated at $631,197, approximately $551 per square foot. 1175 Shell Ln is a home located in Contra Costa County with nearby schools including Mt. Diablo Elementary School, Diablo View Middle School, and College Park High School.
Ownership History
Date
Name
Owned For
Owner Type
Purchase Details
Closed on
May 25, 2012
Sold by
George Bruce E and George Roberta G
Bought by
George Bruce E and George Roberta G
Current Estimated Value
Purchase Details
Closed on
Nov 9, 2005
Sold by
Dellanini Charlotte
Bought by
George Bruce E and George Roberta G
Home Financials for this Owner
Home Financials are based on the most recent Mortgage that was taken out on this home.
Original Mortgage
$423,120
Outstanding Balance
$229,420
Interest Rate
5.87%
Mortgage Type
Purchase Money Mortgage
Estimated Equity
$401,777
Purchase Details
Closed on
Jan 14, 1994
Sold by
The Presley Companies
Bought by
Dellanini Charlotte
Home Financials for this Owner
Home Financials are based on the most recent Mortgage that was taken out on this home.
Original Mortgage
$45,000
Interest Rate
7.16%
Mortgage Type
Purchase Money Mortgage
Create a Home Valuation Report for This Property
The Home Valuation Report is an in-depth analysis detailing your home's value as well as a comparison with similar homes in the area
Home Values in the Area
Average Home Value in this Area
Purchase History
| Date | Buyer | Sale Price | Title Company |
|---|---|---|---|
| George Bruce E | -- | None Available | |
| George Bruce E | $529,000 | Chicago Title | |
| Dellanini Charlotte | $171,000 | North American Title Co |
Source: Public Records
Mortgage History
| Date | Status | Borrower | Loan Amount |
|---|---|---|---|
| Open | George Bruce E | $423,120 | |
| Previous Owner | Dellanini Charlotte | $45,000 |
Source: Public Records
Tax History
| Year | Tax Paid | Tax Assessment Tax Assessment Total Assessment is a certain percentage of the fair market value that is determined by local assessors to be the total taxable value of land and additions on the property. | Land | Improvement |
|---|---|---|---|---|
| 2025 | $2,744 | $126,121 | $36,428 | $89,693 |
| 2024 | $2,486 | $123,649 | $35,714 | $87,935 |
| 2023 | $2,486 | $121,225 | $35,014 | $86,211 |
| 2022 | $2,471 | $118,849 | $34,328 | $84,521 |
| 2021 | $2,427 | $116,519 | $33,655 | $82,864 |
| 2019 | $2,452 | $113,064 | $32,657 | $80,407 |
| 2018 | $2,357 | $110,848 | $32,017 | $78,831 |
| 2017 | $2,269 | $108,676 | $31,390 | $77,286 |
| 2016 | $2,180 | $106,546 | $30,775 | $75,771 |
| 2015 | $2,120 | $104,946 | $30,313 | $74,633 |
| 2014 | $2,053 | $102,892 | $29,720 | $73,172 |
Source: Public Records
Map
Nearby Homes
- 1383 Shell Ln
- 249 Stranahan Cir
- 1105 Peacock Creek Dr
- 1048 Panadero Ct
- 218 Mountaire Cir
- 376 Blue Oak Ln
- 4 Mt Wilson Way
- 5849 Mitchell Canyon Ct
- 5817 Mitchell Canyon Ct
- 5 Pardi Ln
- 1921 Eagle Peak Ave Unit 28
- 5617 Bettencourt Dr
- 105 Crow Place
- 367 Mt Washington Way
- 1421 Lydia Ln
- 186 Mt Wilson Way
- 5612 Frank Place
- 9005 Elk Dr
- 5795 Lewis Way
- 1897 Camino Estrada
Your Personal Tour Guide
Ask me questions while you tour the home.