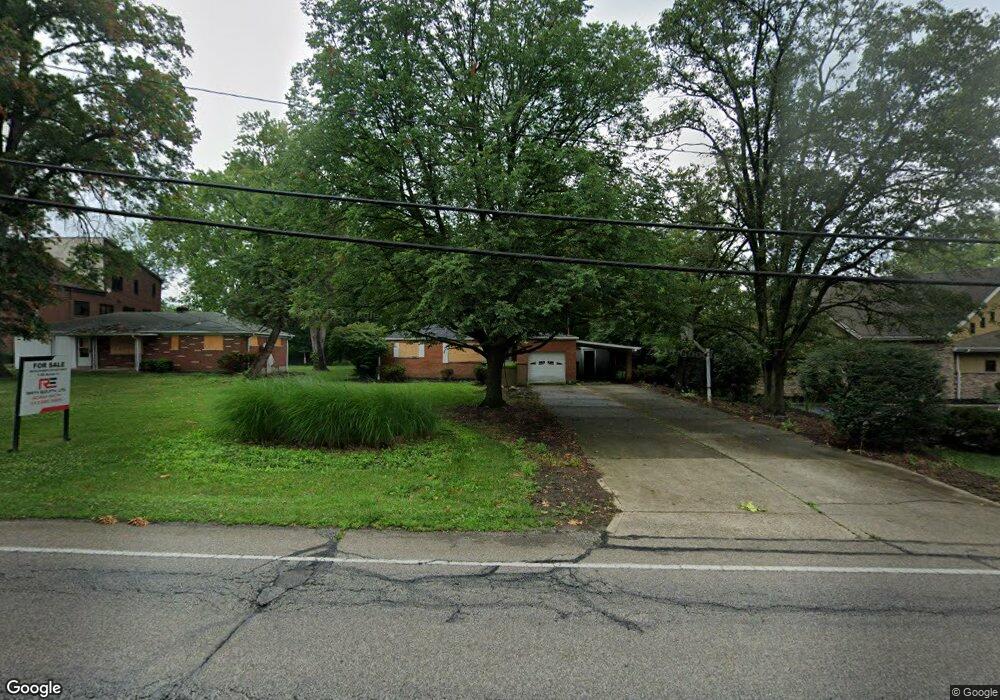
11758 Conrey Rd Unit 11766 Cincinnati, OH 45249
Highpoint NeighborhoodEstimated Value: $188,091 - $264,000
2
Beds
1
Bath
1,032
Sq Ft
$206/Sq Ft
Est. Value
About This Home
This home is located at 11758 Conrey Rd Unit 11766, Cincinnati, OH 45249 and is currently estimated at $213,023, approximately $206 per square foot. 11758 Conrey Rd Unit 11766 is a home located in Hamilton County with nearby schools including Stewart Elementary School, Princeton Community Middle School, and Princeton High School.
Ownership History
Date
Name
Owned For
Owner Type
Purchase Details
Closed on
Apr 2, 2018
Sold by
Mrusek Gregory A and Mrusek Gregory
Bought by
Cincinnati Prosthodontics Llc
Current Estimated Value
Home Financials for this Owner
Home Financials are based on the most recent Mortgage that was taken out on this home.
Original Mortgage
$217,328
Outstanding Balance
$186,724
Interest Rate
4.4%
Mortgage Type
Unknown
Estimated Equity
$26,299
Purchase Details
Closed on
Jun 29, 2001
Sold by
Mrusek Cheryl
Bought by
Mrusek Gregory
Create a Home Valuation Report for This Property
The Home Valuation Report is an in-depth analysis detailing your home's value as well as a comparison with similar homes in the area
Home Values in the Area
Average Home Value in this Area
Purchase History
| Date | Buyer | Sale Price | Title Company |
|---|---|---|---|
| Cincinnati Prosthodontics Llc | $106,651 | Republic Title Agency Inc | |
| Mrusek Gregory | -- | -- |
Source: Public Records
Mortgage History
| Date | Status | Borrower | Loan Amount |
|---|---|---|---|
| Open | Cincinnati Prosthodontics Llc | $217,328 |
Source: Public Records
Tax History Compared to Growth
Tax History
| Year | Tax Paid | Tax Assessment Tax Assessment Total Assessment is a certain percentage of the fair market value that is determined by local assessors to be the total taxable value of land and additions on the property. | Land | Improvement |
|---|---|---|---|---|
| 2024 | $2,683 | $56,151 | $9,828 | $46,323 |
| 2023 | $2,636 | $56,151 | $9,828 | $46,323 |
| 2022 | $2,177 | $37,328 | $8,960 | $28,368 |
| 2021 | $2,163 | $37,328 | $8,960 | $28,368 |
| 2020 | $2,135 | $37,328 | $8,960 | $28,368 |
| 2019 | $2,137 | $34,139 | $7,861 | $26,278 |
| 2018 | $1,950 | $34,139 | $7,861 | $26,278 |
| 2017 | $1,838 | $34,139 | $7,861 | $26,278 |
| 2016 | $1,780 | $31,949 | $8,019 | $23,930 |
| 2015 | $1,758 | $31,949 | $8,019 | $23,930 |
| 2014 | $1,763 | $31,949 | $8,019 | $23,930 |
| 2013 | $1,698 | $31,322 | $7,861 | $23,461 |
Source: Public Records
Map
Nearby Homes
- 12121 3rd Ave
- 12109 4th Ave
- 12152 3rd Ave
- 5600 E Kemper Rd
- 7965 Timberbreak Dr
- 11440 Gideon Ln
- 11794 Tennyson Dr
- 9729 Old Stable Ct
- 11309 Gideon Ln
- ASH LAWN Plan at Sycamore Woods
- CRESTWOOD Plan at Sycamore Woods
- VANDERBURGH Plan at Sycamore Woods
- BRENNAN Plan at Sycamore Woods
- SEBASTIAN Plan at Sycamore Woods
- BENNETT Plan at Sycamore Woods
- BEDFORD Plan at Sycamore Woods
- OAK HILL Plan at Sycamore Woods
- LYNDHURST Plan at Sycamore Woods
- 11485 Gideon Ln
- 5725 Sovereign Dr
- 11758 Conrey Rd
- 11766 Conrey Rd
- 11746 Conrey Rd
- 11734 Conrey Rd
- 11781 Conrey Rd
- 11800 Conrey Rd Unit 220
- 7180 E Kemper Rd
- 7250 E Kemper Rd
- 7260 E Kemper Rd
- 7280 E Kemper Rd
- 6992 E Kemper Rd
- 7225 E Kemper Rd
- 6950 E Kemper Rd
- 7353 E Kemper Rd Unit C & D
- 7351 E Kemper Rd Unit D
- 7351 E Kemper Rd
- 7351 E Kemper Rd Unit C
- 7351 E Kemper Rd Unit C/D
- 7355 E Kemper Rd Unit D
- 7355 E Kemper Rd