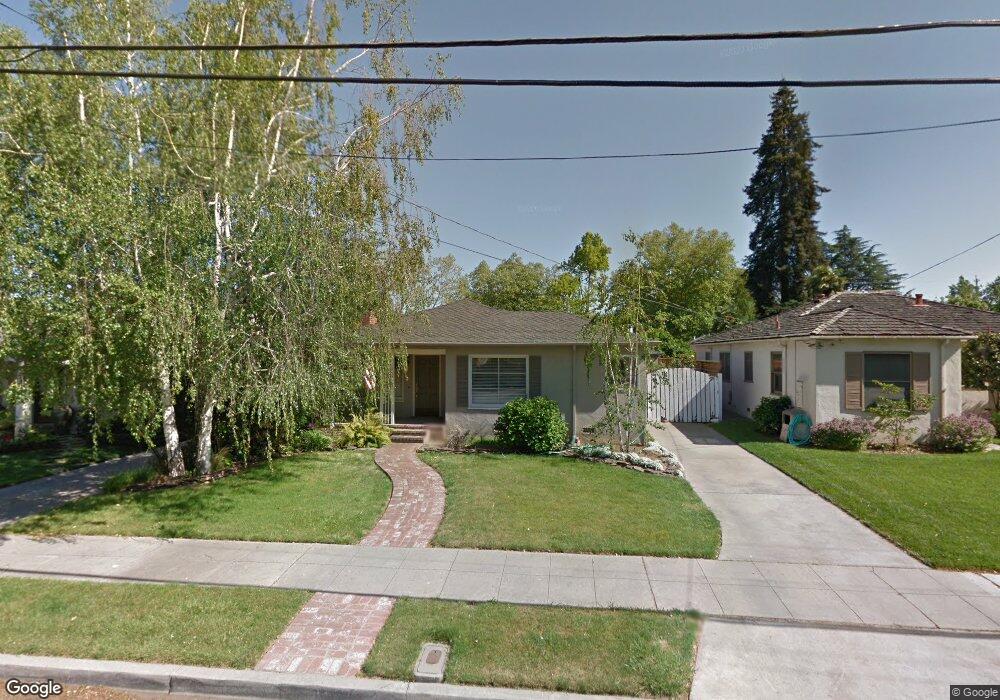
1176 Dean Ave San Jose, CA 95125
Willow Glen NeighborhoodEstimated Value: $1,638,378 - $2,119,000
3
Beds
1
Bath
1,095
Sq Ft
$1,681/Sq Ft
Est. Value
About This Home
This home is located at 1176 Dean Ave, San Jose, CA 95125 and is currently estimated at $1,841,095, approximately $1,681 per square foot. 1176 Dean Ave is a home located in Santa Clara County with nearby schools including Willow Glen Elementary, Willow Glen Middle, and Willow Glen High School.
Ownership History
Date
Name
Owned For
Owner Type
Purchase Details
Closed on
Dec 11, 2003
Sold by
Harkness Harlan W and Harkness Kathleen R
Bought by
Babcock James L and Amador Martha D
Current Estimated Value
Home Financials for this Owner
Home Financials are based on the most recent Mortgage that was taken out on this home.
Original Mortgage
$649,224
Outstanding Balance
$287,547
Interest Rate
5.25%
Mortgage Type
Purchase Money Mortgage
Estimated Equity
$1,553,548
Purchase Details
Closed on
Feb 11, 1998
Sold by
Harkness Harlan W
Bought by
Harkness Harlan W and Harkness Kathleen R
Purchase Details
Closed on
May 25, 1995
Sold by
Harkness Harlan W
Bought by
Harkness Harlan William
Purchase Details
Closed on
Feb 17, 1994
Sold by
Reischl Thomas A and Reischl Shannon E
Bought by
Harkness Harlan W and Weingart Kathleen R
Home Financials for this Owner
Home Financials are based on the most recent Mortgage that was taken out on this home.
Original Mortgage
$243,200
Interest Rate
7.59%
Create a Home Valuation Report for This Property
The Home Valuation Report is an in-depth analysis detailing your home's value as well as a comparison with similar homes in the area
Home Values in the Area
Average Home Value in this Area
Purchase History
| Date | Buyer | Sale Price | Title Company |
|---|---|---|---|
| Babcock James L | $710,000 | Financial Title Company | |
| Harkness Harlan W | -- | -- | |
| Harkness Harlan William | -- | -- | |
| Harkness Harlan W | $304,000 | Old Republic Title Company |
Source: Public Records
Mortgage History
| Date | Status | Borrower | Loan Amount |
|---|---|---|---|
| Open | Babcock James L | $649,224 | |
| Previous Owner | Harkness Harlan W | $243,200 |
Source: Public Records
Tax History Compared to Growth
Tax History
| Year | Tax Paid | Tax Assessment Tax Assessment Total Assessment is a certain percentage of the fair market value that is determined by local assessors to be the total taxable value of land and additions on the property. | Land | Improvement |
|---|---|---|---|---|
| 2025 | $12,943 | $1,009,456 | $746,434 | $263,022 |
| 2024 | $12,943 | $989,664 | $731,799 | $257,865 |
| 2023 | $12,943 | $970,259 | $717,450 | $252,809 |
| 2022 | $12,591 | $951,235 | $703,383 | $247,852 |
| 2021 | $12,336 | $932,585 | $689,592 | $242,993 |
| 2020 | $12,061 | $923,024 | $682,522 | $240,502 |
| 2019 | $11,806 | $904,927 | $669,140 | $235,787 |
| 2018 | $11,691 | $887,184 | $656,020 | $231,164 |
| 2017 | $11,598 | $869,789 | $643,157 | $226,632 |
| 2016 | $11,406 | $852,736 | $630,547 | $222,189 |
| 2015 | $11,334 | $839,928 | $621,076 | $218,852 |
| 2014 | $10,871 | $823,475 | $608,910 | $214,565 |
Source: Public Records
Map
Nearby Homes
- 1176 Laurie Ave
- 1655 Everett Ave
- 1548 Lincoln Ave
- 1110 Norval Way
- 1719 Glen Una Ave
- 1242 Minnesota Ave
- 1344 Iris Ct
- 1037 Hazelwood Ave
- 1768 Harmil Way
- 0 Willow Glen Way
- 1920 Glen Una Ave
- 1206 Malone Rd
- 910 Pine Ave
- 888 Pine Ave
- 1265 Blewett Ave
- 1951 Jonathan Ave
- 1109 Lincoln Ct
- 1105 Lincoln Ct
- 1232 Coolidge Ave
- 1192 Crescent Dr